Download
1 / 46
460 likes | 625 Views
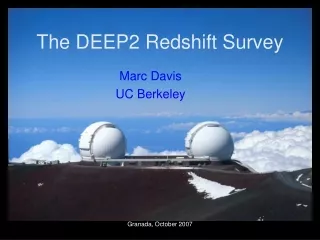
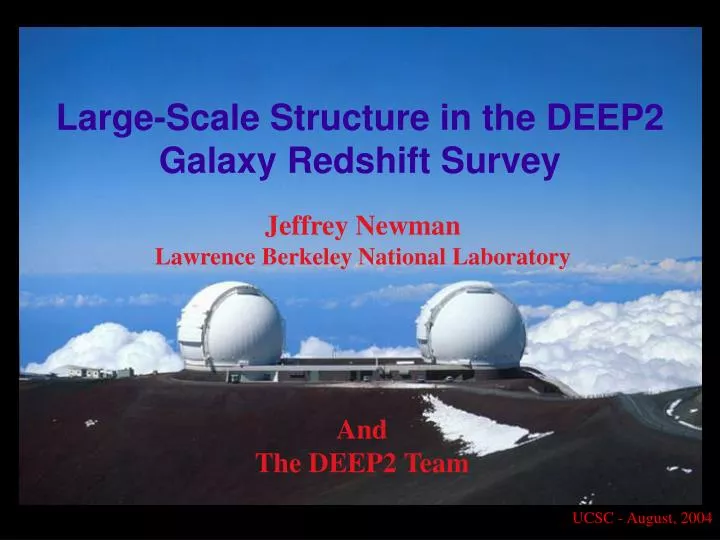
Large-Scale Structure in the DEEP2 Galaxy Redshift Survey. Jeffrey Newman Lawrence Berkeley National Laboratory. And The DEEP2 Team.

E N D
Large-Scale Structure in the DEEP2 Galaxy Redshift Survey Jeffrey Newman Lawrence Berkeley National Laboratory And The DEEP2 Team
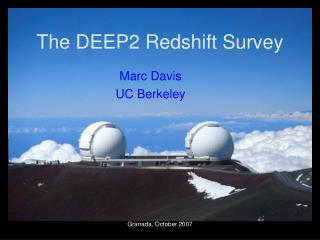
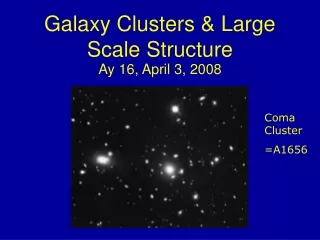
The DEEP2 Galaxy Redshift Survey, which uses the DEIMOS spectrograph on the Keck II telescope, is studying both galaxy properties and large-scale structure at z=1. Large-Scale Structure of the DEEP2 team U.C. Santa Cruz S. Faber (Co-PI) D. Koo P. Guhathakurta D. Phillips C. Willmer B. Weiner R. Schiavon K. Noeske A. Metevier L. Lin N. Konidaris G. Graves JPL P. Eisenhardt Princeton D. Finkbeiner U. Pitt. A. Connolly K survey (Caltech) K. Bundy C. Conselice R. Ellis U.C. Berkeley M. Davis (PI) A. Coil M. Cooper B. Gerke R. Yan C. Conroy LBNL J. Newman U. Hawaii N. Kaiser
LSS provides the link between galaxies and their cosmological context Nearly Normal(?) Galaxies LSS Universe LCDM
Outline I. The DEEP2 Redshift Survey • Clustering of Galaxies in DEEP2 • DEEP2 galaxies and their environments • Galaxy groups in DEEP2 • Voids in DEEP2
Scientific Goals of the DEEP2 Galaxy Redshift Survey • Characterize the properties of galaxies (colors, sizes, linewidths, luminosities, etc.) at z~1 for comparison to z~0 • Study the clustering statistics (2- and 3-pt. correlations) of galaxies as a function of their properties, illuminating the nature of the galaxy bias • Determine N(s,z) of groups and clusters at high redshift, providing constraints on m andw • Measure thesmall-scale “thermal” motions of galaxies at z~1, providing a measure of the mass of the halos the galaxies are within
Comparison with Local Surveys DEEP2 was designed to have comparable size and density to the previous generation local redshift surveys and is >50 times larger than past surveys at z~0.3-1. SDSS 2dF DEEP2 is similar to LCRS in sample size, but at z~1 LCRS DEEP2 CFA+ SSRS z~0 z~1 PSCZ
DEEP2 has been made possible by DEIMOS, a new instrument on Keck II DEIMOS (PI: Faber) and Keck provide a unique combination of wide-field multiplexing (up to 160 slitlets over a 16’x4’ field), high resolution (R~5000), spectral range (~2600 Å at highest resolution), and telescope size.
A Redshift Survey at z~1 • Observational details: • 3 sq. degrees over 4 fields • primary z~0.75-1.4 (pre-selected using BRI photometry) • ~5·106 h-3Mpc3 volume • lookback 6 - 8.5Gyr • >400 1-hour exposures • >40,000 z’s to RAB=24.1 • 1200 l/mm: ~6500-9200 Å • 1.0” slit: FWHM 68 km/s Color cut used in 3 of 4 DEEP2 fields
Redshift Distribution of Data: z~0.7-1.4 Our color cuts are very successful! ~90% of our targets are at z>0.75 and we miss only 3% of high-z objects. • Status: • Designed as a • three-year survey • Began summer 2002 • 80 night UC time allocation is now complete • Finished 3 of 4 fields, 4th • >75% done (will complete • in S06)
DEEP2/CFHT B,R,I GALEX NUV+FUV Chandra & XMM: Past coverage Awarded (1.4Ms) Coordinated observations ofthe Extended Groth Strip (EGS) Spitzer MIPS, IRAC Background: 2 x 2 deg from POSS DEEP2 spectra and Caltech / JPL Ks imaging HST/ACS V,I (Cycle 13) Plus VLA (6 & 21 cm), SCUBA, etc….
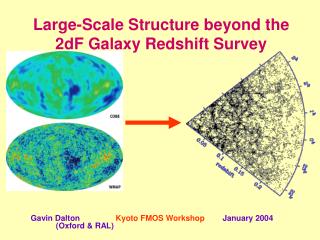
LSS in DEEP2 vs. local surveys Structure seen in DEEP2 7 Gyr ago looks similar to that in SDSS (rescaling by the cosmic expansion); another sign that we live in a Universe with low Om. Detailed studies can test Dark Energy models and galaxy formation scenarios.
DEEP2 sees the same color bimodality as SDSS, COMBO-17, etc. to z~1.4 Willmeret al. 2005 Our R-band magnitude limit corresponds to ~4000Å rest-frame at z=0.7, ~2800 Å at z=1.4 . As redshift increases, red galaxies of a given luminosity fall out before blue ones. Nevertheless, bimodality appears to persist to the limits of the survey, and is a vital tool for many of our analyses.
Galaxy Clustering in DEEP2 We are now performing a second generation of studies of the galaxy correlation function using volume-limited samples and a much larger dataset. Locally, x(r) is roughly a power-law: (r0/r)g with r0~5 Mpc/h and g~1.8. Local trends of correlation vs. color persist at z~1. (for L>=L*, z=0.7-1.0, preliminary:) red: r0=5.09 (0.11) g=1.95 (0.05) blue:r0=3.56 (0.07) g=1.74 (0.05) Coil et al. 2005, in prep.
x(rp,p) depends strongly on color Red galaxies not only have a larger correlation length, but also larger velocity dispersion/fingers of god: they reside in more clustered / denser environments. We detect coherent infall on large scales for both blue and red galaxies. Coil et al. 2005, in prep.
Clustering vs. Luminosity in DEEP2 We are starting to measure correlation statistics of galaxies as a function of many other properties: luminosity, linewidth/velocity dispersion, stellar mass, morphology, etc. Many comparisons to models will soon be possible. As at low z, brighter galaxies cluster more strongly in DEEP2. Coil et al. 2005, in prep.
We measure galaxy environments using projected 3rd-nearest neighbor distance, shown to be near-optimal in Cooper et al. 2005 (accepted). As at z~0, there is a strong trend of galaxy density with restframe color. [OII] trends are weaker and explained by color. SDSS (Blanton et al. 2004) DEEP2 Galaxy Properties and Environment linear overdensity log overdensity bluecolorred bluecolorred Cooper et al. 2005, in prep.
Basic trends from z~0 studies persist at z~1: e.g., the reddest and brightest galaxies are preferentially found in dense environments. Environment over the CMD SDSS, z~0.1 DEEP2, 0.75<z<1.05 redder brighter Cooper et al. 2005, in prep.
However, unlike locally, red and blue galaxies have very similar trends of environment vs. luminosity at z~1. Suggestive that the bright blue galaxies we see at z~1 will be part of the red population at z~0. Environment over the CMD, II Blue galaxies Red galaxies denser brighter Cooper et al. 2005, in prep.
position l, z Galaxy groups in DEEP2 We can focus on galaxy populations in the densest regions by studying groups of galaxies. We identify groups in DEEP2 by finding overdensities in the galaxy distribution in redshift space using the VDM algorithm of Marinoni et al. (2002). We are identifying groups in DEEP2 not only to study galaxy evolution, but also because their apparent abundance provides a test of dark energy models. (N.B. For our purposes, “clusters” are just especially massive groups.) Group in early DEEP2 data ~250 km/sec
Evolution of blue fraction in groups We define the blue fraction using galaxies to the left of a limit shown by the dashed line in the CMDs below (to which we are complete at all z), dividing at the dotted line. Blue fraction is lower in groups than the field, but appears to be converging at z~1.1. Gerke et al. 2005, in prep. (SEE POSTER!)
Group & galaxy correlation functions We can also use correlation statistics to study the relationship between galaxies and groups. The group-galaxy cross-correlation shows how galaxies are clustered within and around groups. Red galaxies are preferentially found near the centers of DEEP2 groups, while blue galaxies actively avoid them. We’re testing the same thing in many ways… Coil et al. 2005, submitted, astro-ph/0507647
Group-based correlations are sensitive to relationship between galaxies & halos Mock catalogs which match early DEEP2 (r) predict very different clustering of group galaxies or field galaxies than observed. Coil et al. 2005, submitted, astro-ph/0507647
Void statistics at z~1 and z~0 • We have studied the Void Probability Function (VPF) - the probability that a sphere of radius R centered at a random point contains no galaxies - using both DEEP2 and SDSS data. The VPF can be described by an infinite sum of higher-order correlation functions and potentially contains a wealth of information on biasing, etc. However, a simple “negative binomial” ansatz predicts the observed VPF very well, given only the two-point correlation function and the number density of the tracer used. Conroy et al. 2005, submitted, astro-ph this week
Measuring the VPF Voids are larger for brighter / redder / less common galaxies. “Negative binomial” ansatz works fairly well for both DEEP2 & SDSS data, for all subsamples and scales probed. DEEP2 “Negative binomial” model matches VPF for dark matter halo centers (not mass points) in simulations - insensitive to halo model parameters. SDSS Conroy et al. 2005, submitted
ITo understand the evolution of galaxies, we need to know not just how things change… but where! + DEEP2 is opening many new windows on galaxies by allowing us to study them within their LSS context over a >7 billion year span. Many more analyses still to come!
Other recent and upcoming papers include: • Angular clustering of galaxies: Coil et al., 2004, ApJ, 617, 765 • DEEP2 survey strategy & dark energy: Davis et al.,astro-ph/0408344 • Evolution of close-pairs/merger rates: Lin et al., 2004, ApJ, 617, 9 • DEEP2 Group catalog: Gerke et al., 2005, ApJ, 625, 6 • Satellite galaxy kinematics: Conroy et al., astro-ph/0409305 • Environment in deep redshift surveys: Cooper et al., acc. (0506518) • DETF white paper: Davis et al., astro-ph/0507555 • Luminosity function: Willmer et al. & Faber et al., submitted • Metallicities of DEEP2 galaxies:Shapley et al., submitted • K+Agalaxies in DEEP2 : Yan et al., in prep. (SEE POSTER!) • Test for evolution in fine structure constant: Newman et al., in prep. First semester’s data is now public: http://deep.berkeley.edu/DR1
Color vs. Equivalent Width of [OII] Red galaxies have low [OII] equivalent width, while blue galaxies span a wide range. It appears that the scatter in this relation is most likely not due to environment. Color correlates better with environment than [OII] EW; there is little residual trend when env. vs. color trend is removed (diamonds).
In Newman et al. (2002) we showed that the apparent abundance of groups as a function of redshift and velocity dispersion, dN(s,z)/dzds, provides a useful test of the dark energy equation of state. For modest-mass groups, this is dominated by differences in the volume element (which varies by 3x between w=0 and w=-1), though affected by the growth factor as well. Why search for groups in DEEP2?
We have recently added completely-covariant (i.e. pessimistic) systematic errors to our constraint estimates, and fixed an error in our growth factor calculations noticed by Eric Linder. Here we plot the new 95% error contours for a LCDM model resulting from combining DEEP2 with SDSS results, including systematic errors but assuming s8 is known. Changes to constraint estimates Tests with mocks indicate we can use groups with s>350 km/sec reliably.
As for most techniques, constraints are a bit stronger for w=-0.7 models than w=-1. Constraints for w=-0.7
We are beginning to measure w… N(s) from 314 groups are plotted. Even ignoring redshift information, the sensitivity to w is clear. However, the group abundance also depends on other parameters we need to tie down… Furthermore, we are still checking systematics!! Gerke et al. 2005
s8 Dependence of N(s) The normalization of the Power Spectrum, 8, can strongly influence the abundance of groups, as if 8 is greater, fluctuations are larger and groups are more common. To be able to constrain w, we need an accurate measurement of 8 . New SDSS studies are now making this possible (e.g.. Seljak et al. 2004).
M Dependence of N(s) The number of high-redshift groups is sensitive to M . However, given a value of s8, the z~0 SDSS cluster abundance will tie down M very tightly (Newman et al. 2002).
Velocity bias and N(s) A final degenerate parameter is the “velocity bias”, bv. This is the factor by which the velocity dispersion of galaxies in a cluster differs from the dark matter dispersion. Some simulations currently favor bv=1.1, others 0.9. In the end, our results match bv~1.1, M ~0.4, 8~1, or w ~-1.25.
Some conclusions • Our results are consistent with no evolution in the fine structure constant from z~0 to z~0.7. • Large surveys can make possible many kinds of scientific discoveries, and go far beyond whatever topics and fields are thought to be interesting when the survey is designed. • Future baryonic oscillation surveys may be able to do very well at constraining evolution in , if they have the resolution and right wavelength coverage; they will have large samples of bright, star-forming galaxies at z~1. 100x larger samples may be feasible.
Looking for changes from z=0 Start with the simplest thing: combine all data with z>0.6 into one bin, and measure <Da2>.
Redshift Maps in 4 Fields: z=0.7-1.3 Cone diagram of 1/12 of the full DEEP2 sample
position l Finding groups in DEEP2 We find groups using the locations of galaxies in redshift space - no photometric information is used, just the overdensity in the 3d galaxy distribution. In particular, we are using the Voronoi-Delaunay Method of Marinoni et al. (2002), which has been optimized for use at high z and performs well. (For our purposes, “clusters” are just especially massive groups.) Group in early DEEP2 data
In Newman et al. (2002) we showed that the apparent abundance of groups as a function of redshift and velocity dispersion, dN(s,z)/dzds, provides a useful test of the dark energy equation of state. Here we plot the expected 95% error contours for LCDM from combining DEEP2 with SDSS results, including systematics. Tests with mocks indicate we can use groups with s>350 km/sec for this. Why search for groups in DEEP2?
First DEEP2 Group Catalog We currently have group catalogs for 3 fields Gerke et al. 2005,astro-ph/0410721
Group Richness Distribution Ngroups (s>200 km/s) group richness Most groups have N=2-3 within our sample (but we are sampling ~L* galaxies - there are many more fainter galaxies in these groups) Gerke et al.2005, astro-ph/0410721
Galaxy properties in groups We are using the group catalog to study galaxy properties within groups. We find that redder, early-type galaxies are preferentially found in groups at z~1, similar to local trends. Gerke et al. 2005 0.7<z<0.9
The Voronoi-Delaunay Method Group-Finder (VDM) • We use the Voronoi cell volume to find dense regions: potential ‘group seeds’. • Then we use the Delaunay mesh, its geometric dual, to estimate density of group core. • Then we search adaptively for group members based on central density estimate. • We have been testing VDM extensively using realistic DEEP2 mock catalogs to optimize the group-finder and test our systematics.
K+A Post-Starburst Galaxies Have ~100 galaxies with features of K stars (old, elliptical-type spectra) and A stars (youngish, <1 Gyr) - K+A galaxies. Yan et al. in prep K+A galaxies show little on-going star-formation (lack of OII) but strong Balmer features due to recent star-formation (within 1 Gry) - ‘post-starburst galaxies’. These objects are rare, but we cover a large enough volume to find a large statistical sample.
K+A Post-Starburst Galaxies These galaxies populate the ‘gap’ in the color bi-modality and lie on the red sequence - they may provide clues as to how galaxies move onto the red sequence. We are currently estimating evolution in the rate of K+A galaxies from z=1 to z=0 and investigating their morphologies and environments. Yan et al. in prep