Download
1 / 35
350 likes | 354 Views
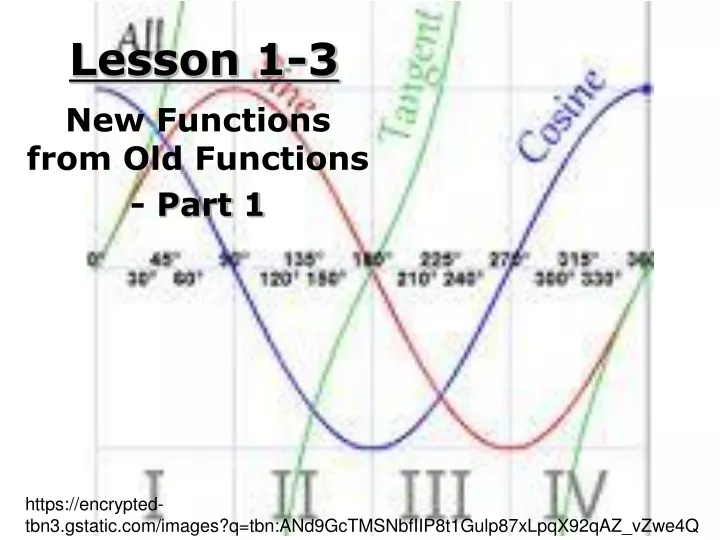
Lesson 1-3. New Functions from Old Functions - Part 1. https://encrypted-tbn3.gstatic.com/images?q=tbn:ANd9GcTMSNbfIIP8t1Gulp87xLpqX92qAZ_vZwe4Qu308QRANh_v4UHWiw. At this point in time it is important to know and remember certain parent functions and their graphs.

E N D
Lesson 1-3 New Functions from Old Functions - Part 1 https://encrypted-tbn3.gstatic.com/images?q=tbn:ANd9GcTMSNbfIIP8t1Gulp87xLpqX92qAZ_vZwe4Qu308QRANh_v4UHWiw
At this point in time it is important to know and remember certain parent functionsand their graphs.
Now, by recognizing a parent functionsgraph and then applying certain transformations, we can see how various other graphs can be obtained.
We are going to want to sketch these other graphs by hand and also come up with their equations.
Let’s first consider translations. Simply by adding or subtracting a constant c to a formula of a function can cause a slide up, down, right, or left, of a parent functions graph.
Vertical and Horizontal shifts: Suppose c > 0, to obtain y = f(x) + c shift the graph of y = f(x) a distance of c units upward y = f(x) – c shift the graph of y = f(x) a distance of c units downward y = f(x – c) shift the graph of y = f(x) a distance of c units to the right y = f(x + c) shift the graph of y = f(x) a distance of c units to the left
Vertical and Horizontal shifts: Suppose c > 0, to obtain y = f(x) + c shift the graph of y = f(x) a distance of c units upward y = f(x) – c shift the graph of y = f(x) a distance of c units downward y = f(x – c) shift the graph of y = f(x) a distance of c units to the right y = f(x + c) shift the graph of y = f(x) a distance of c units to the left
Vertical and Horizontal shifts: Suppose c > 0, to obtain y = f(x) + c shift the graph of y = f(x) a distance of c units upward y = f(x) – c shift the graph of y = f(x) a distance of c units downward y = f(x – c) shift the graph of y = f(x) a distance of c units to the right y = f(x + c) shift the graph of y = f(x) a distance of c units to the left Catchy little phrase: Add to y means go “high”, add to x means go “west”.
When multiplying or dividingby a constant, this canproduce various kinds of stretching, shrinking, or reflections of the graph of a function.
Vertical and Horizontal Stretching and Reflecting Suppose c > 1, to obtain
Vertical and Horizontal Stretching and Reflecting Suppose c > 1, to obtain y = cf(x), stretch the graph of y = f(x) vertically by a factor of c y = (1/c)f(x), compress the graph of y = f(x) vertically by a factor of c y = f(cx), compress the graph of y = f(x) horizontally by a factor of c y = f(x/c), stretch the graph of y = f(x) horizontally by a factor of c y = - f(x), reflect the graph of y = f(x) about the x-axis y = f(-x), reflect the graph of y = f(x) about the y-axis
Example: The most common mistake made is to do the transformations in the wrong order!
Example: The most common mistake made is to do the transformations in the wrong order! (Hint: Follow rules for order of operations.) (pemdas)
Now lets take a look at what absolute value | | surrounding a function does to a graph.
When you take the absolute value of a function f(x), the graph of|f(x)| will be the graph of f(x) except that the part of the graph of f(x) below the x axis will be reflected above the x-axis!