Download
1 / 16
160 likes | 243 Views
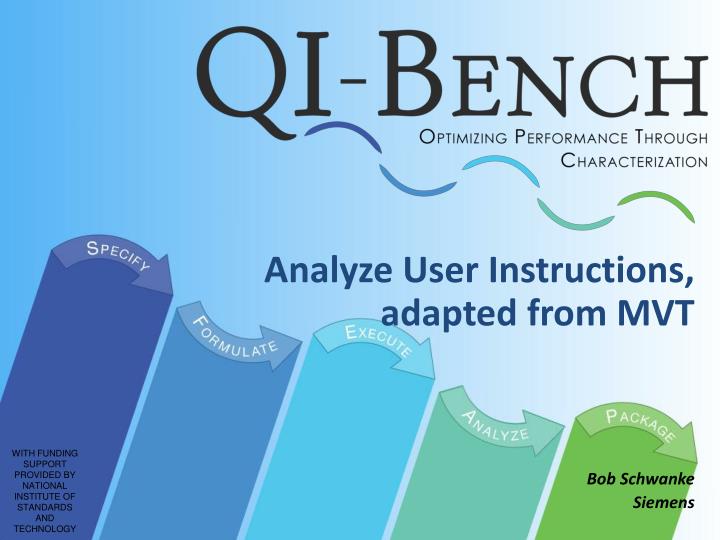
Analyze User Instructions, adapted from MVT Bob Schwanke Siemens. With Funding Support provided by National Institute of Standards and Technology. QI-Bench Overview. RDF Triple Store. obtained_by. CT Volumetry. CT. used_for. m easure_of. Therapeutic Efficacy. Tumor growth. Specify.

E N D
Analyze User Instructions, adapted from MVT Bob Schwanke Siemens With Funding Support provided by National Institute of Standards and Technology
QI-Bench Overview RDF Triple Store obtained_by CT Volumetry CT used_for measure_of Therapeutic Efficacy Tumor growth Specify Execute Formulate Feedback Reference Data Sets Analyze QIBO Feedback Y=β0..n+β1(QIB)+β2T+ eij 2 2 2
BiomarkerDB.SummaryStatistic+ = Analyze ({ReferenceDataSet .CollectedValue}); 3
Choose Biomarker Measurements to Analyze (we’ll be adding Measurements) Deselect RECIST and WHO measurements
Some Methods exist; we will create new ones (e.g., factor analysis) R Script for summary statistic
Columns for calculation according to the Methods Column per measurement
Output of Analysis Type run (this example intra-reader) Intra- and Inter-reader comparisons
Output of Analysis Type run (this example inter-reader) Inter-reader measurements
Additional outputs based on Methods … calculated
Outlier Analysis with Drill-down is Supported (access to raw imagery) Outliers list
Resulting plots – we’ll be adding plot types, e.g., box, radar, and K-M Configure plots as needed