Download
1 / 50
500 likes | 624 Views
Urban and Regional Models : Integration across Space , Time and Policy Fields Michael Wegener. Symposium Integration of Land-Use and Transport Models TUM Science & Study Center, Raitenhaslach, 2-4/11/2016. Objective. 2. Objective

E N D
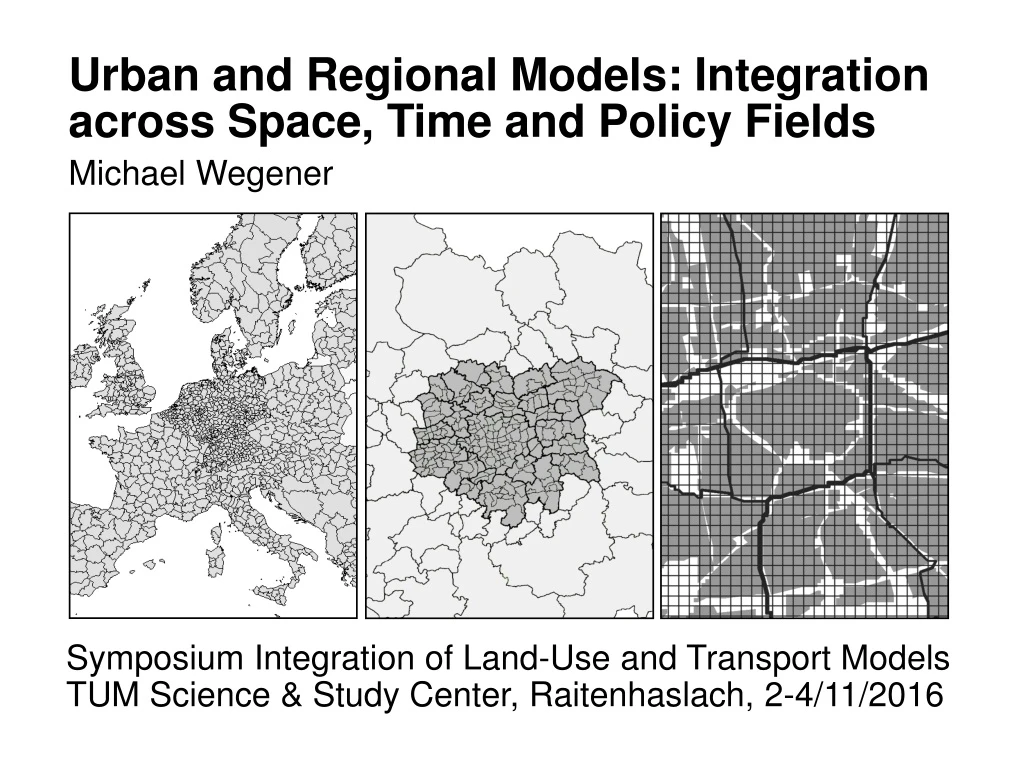
Urban and Regional Models: Integration across Space, Time and Policy Fields Michael Wegener Symposium Integration of Land-Use and Transport Models TUM Science & Study Center, Raitenhaslach, 2-4/11/2016
Objective Most urban and regional models have been developed for different policy fields at different levels of spatial and temporal resolution. But it has become apparent that urban policy fields are interdependent and need to be modelled together. The first urban and regional models were aggregate in space and static in time. More recently new data sources and computer techniques have stimulated a trend towards ever more disaggregation in space and time. This paper argues for models that are instead multi-level and multi-scale in subsystems, space and time.
Urban models in the 1980s Urban models today SAL IMR URB MEP MEP PEC ILU TLU ILM LIL IRP IRP TXL PUM BOY HUD STA MET ITL MAR KIM KIM CAL RUR ITL POL POL OSA TRA MUS DEL CUF TOP TRE 5 5
CUF KIM POL STA MAR IRP MPL IMR DEL MUS MEP MET RUR PEC TLU TRA TRE TXL Development path ILM ILT PUM URB Trends in urban modelling (adapted from Miller et al. 1998)
ILUMASS 7
The ILUMASS project (2001-2006) • The project ILUMASS (Integrated Land-Use Modelling and Transport Systems Simulation) combined • a microscopic activity-based simulation model of urban traffic flows • a microscopic agent-based model of household and firm development and the resulting changes of land and housing markets. • a model of environmental impacts.
Land use ILUMASS model Accessibility - of jobs - of shops - of population - of facilities Firms - floorspace - firms - jobs Population - housing - households - persons - cars Transport Person travel demand - activities - week plans - trips Dynamic assignment - link flows Goods trans-port demand - activities - trips Environmental impacts Impacts - air quality - traffic noise at housing Impacts - air quality, - traffic noise at work Emissions - air pollution, - traffic noise at sources
ILUMASS model dimensions 1.2 million households 2.6 million persons 1.2 million dwellings 80,000 firms 92,000 industrial sites 8,400 public transport links 848 public transport lines 13,000 road links 246/54 internal/external zones 209,000 raster cells 30 simulation periods (years) 3-5 days computing time) Conclusions
Firms Firms/households Firms/households Firms/households Firms Firms/households New firms New households New firms New households New firms New households New firms New households 11 11 11 11 Births(Deaths ►
Households Births/deaths Households Births/deaths Households Births/deaths Births/deaths Households Households Births/deaths Households Births/deaths Births Deaths Births Deaths Births Deaths Births Deaths Births Deaths Births Deaths 12 12 12 12 12 12 Dwellings ►
Households Dwellings Households Dwellings Households Dwellings Dwellings New dwellings Demolitions New dwellings Demolitions New dwellings Demolitions New dwellings 13 13 13 13 13 Moves ►
Households Moves Moves Moves Moves Moves Outmigration Immigration New household Move Outmigration Immigration New household Move Outmigration Immigration New household Move Outmigration Immigration New household Move Outmigration Immigration New household Move 14 14 14 14 14 End of ILUMASS ►
The end of ILUMASS • The ILUMASS project was quite successful.in developing individual submodels.. • However, it was not successful in implementing the planned integrated model of land use and transport: • The land use, transport and environment submodels of ILUMASS were independent executables. • The application programming interface (API) connecting submodels via files never worked properly. • Data exchange between submodels was slow. • The computing times of the transport submodels took days for each year. Conclusions
The "little" ILUMASS After the end of the project the Dortmund group decided to replace the microscopic transport and environmental sub-models were replaced by the aggregate transport model of the IRPUD model and by simpler environmental impact models. The resulting "little" ILUMASS modelconsisted of only two executables and took only 90 minutes for the whole 30-year simulation. Conclusions
Microsimulation New activity-based microsimulation models improve urban simulation models: -Lifestylescan be represented, i.e. households and individuals can be disaggregated to the agent level. - Environmental impactsand feedback can be modelled with the required spatial resolution. -Population and employment can be represented by their decision making units, i.e. householdsand firms. -Microlocationscan be represented. Households affected by environmental impacts can be localised. PROPOLIS & ILUMASS
However ... To date, no full-scale microsimulation model of urban land use, transport and environment has become operational. There are still unresolved problems regarding the inter-faces between the submodels. The feedback between transport and environmental quality and location has not yet been implemented. The computing time for existing models is calculated in terms of weeks or days, not hours. Serious problems of calibration, instability and random fluctuations have not yet been solved. Conclusions
Stochastic variation Stochastic variation Stochastic variation 1000 choices 100 alternatives Wegener (2011) 1000 choices 400 alternatives Wegener (2011) 1000 choices 900 alternatives Wegener (2011) 20 20 20
Limits of microsimulation There are ultimate limits to increasing the substantive, spatial and temporal resolution of behavioural models: - There are theoretical limits when the number of pro-cesses simulated is too small to yield reliable results. - There are empirical limits when the marginal costs of obtaining micro data are larger than their added value. - There are practical limits when the computing time of the models exceed the duration of the modelled processes. - There are ethical limits to the collection of data about private lives for purposes of research. Conclusions
How much micro is enough? There seems to be little consideration of the benefits and costs of microsimulation: - Where is microsimulation really needed? - What is the price for microsimulation? - Would a more aggregate model do? For spatial planning models, the answer to these questions depends on the planning task at hand. Conclusions
Dortmund City Dortmund Dortmund Regions Zones Raster cells Model levels Multi-level Multi-scale
Dortmund City Dortmund Dortmund Regions Zones Raster cells Level 1: regions
Production function Migration function Accessibility Income Transport policy GDP Population Labour force Unemploy- ment Employment SASI model
Scenario A1 GDP per capita Difference from Scenario A-1 in year 2031 Scenario B1 GDP per capita Difference from Scenario A-1 in year 2031 Scenario C1 GDP per capita Difference from Scenario A-1 in year 2031 8 - 10 6 - 8 4 - 6 2 - 4 0 - 2 -2 - 0 -4 - -2 -6 - -4 -8 - -6 -10 - -8 8 - 10 6 - 8 4 - 6 2 - 4 0 - 2 -2 - 0 -4 - -2 -6 - -4 -8 - -6 -10 - -8 8 - 10 6 - 8 4 - 6 2 - 4 0 - 2 -2 - 0 -4 - -2 -6 - -4 -8 - -6 -10 - -8 Dortmund Dortmund Dortmund 27 27 27
Dortmund City Dortmund Dortmund Regions Zones Raster cells Level 2: zones
Labour market Employment Workplaces Population households Market for nonresidential buildings Transport market Housing market Residential buildings Nonresidential buildings Land market from SASI model Microsimulation IRPUD model
CO2-Emissionen Verkehr je Einwohner je Tag (kg) CO2 emission by transport per capita per day (kg) CO2 emission by transport per capita per day (kg) CO2 emission by transport per capita per day (kg) CO2-Emissionen Verkehr je Einwohner je Tag (kg) CO2 emission by transport per capita per day (kg) -20% -20% -20% -20% CO2-Emissionen je Einwohner je Tag (kg) CO2-Emissionen je Einwohner je Tag (kg) -30% -30% CO2 emission by transport per capita per day (kg) CO2 emission by transport per capita per day (kg) -40% 30 30 30 30 30 30 30 30 30 30 30 30 30 30 30 30 CO2 emission by transport per capita per day (kg) 30 30 30
Dortmund City Dortmund Dortmund Regions Zones Raster cells Level 3: raster cells
Input Raster model IRPUD model output - Population by zone - Employment by zone - Floorspace by zone - Traffic by link GIS database - Zones - Networks - Land use Spatial disaggregation Raster data - Population - Employment - Floorspace - Traffic Raster data - Cars - Trains - Busses - Speeds Environmental and social impacts Impacts - Resource use Impacts - Emissions Impacts - Air quality Impacts - Traffic noise Impacts - Environment Impacts - Accessibility
Raster model Air quality Raster model Traffic noise 33 33
New challenges for urban models (1) • To cope with the new challenges of energy scarcity and • climate change urban models need to be able to predict • the decision behaviour of households and firms under • fundamentally different conditions: • Climate change: mitigation • - high carbon or fuel taxes • - high road pricing or congestion charges • - heavy use of public transport • - rigorous speed limits, car-free zones • Climate change: adaptation • - flood prevention and management • - rigorous land use controls to prevent development • in floodplains and fresh-air corridors • (continued)
New challenges for urban models (2) • Energy scarcity: • - alternative vehicles/fuels • - decentralised energy (solar, geothermal, photovoltaic) • - heat insulation of buildings • Social conflicts: • - groups/communities most affected by climate change • and energy scarcity • - minimum standards of access to basic services • New technologies: • - car-sharing • - online shopping • - self-driving cars
Ruhr model raster cells 70 km 41 120 km
Labour market Employment Workplaces Population households Market for nonresidential buildings Transport market Housing market Residential buildings Nonresidential buildings Land market Microsimulation Ruhr model Energy CO2 Energy CO2 Energy CO2 Energy CO2 Energy CO2
Energy-retrofitted residential buildings 2050 (%) Scenario A31 43
Station-less car-sharing cars 2050 (%) Scenario A33 44
Conclusions 47
Urban models and fundamental change The fundamental changes in the problems and priorities of urban planning will have deep impacts on the philoso-phy and methodof urban modelling: - less detail, more basic essentials - less extrapolation, more fundamentalchange - less equilibrium, more dynamics - less observedbehaviour, more theory on needs - less preferences and choices, more constraints - less calibration, more plausibility analysis - less forecasting, more backcasting (don't ask what can be done but what needs to be done)
Multi-level, multi-scale models These considerations lead to a reassessment of the hypo-thesis that in the future all spatial modelling will be micro-scopic and agent-based. Under constraints of data collection and of computing time, there is for each planning problem an optimum level of conceptual, spatialand temporalresolution. This suggests to work towards a theoryof balanced multi-level modelswhich are as complexas necessary for the planning task at hand and – to quote Albert Einstein – "as simple as possible but no simpler". Conclusions
More information Wagner, P., Wegener, M. (2007): Urban land use, transport and environment models: experiences with an integrated microscopic approach. disP170 (3/2007), 45-56. http://www. spiekermann-wegener.de/pub/pdf/PWMW_ILUMASS.pdf Wegener, M. (2011): From macro to micro – how much micro is too much? Transport Reviews 31, 2, 161-177. ILUMASS model: http://www.spiekermann-wegener.de/mod/ilumassmod.htm STEPs project: http://www.spiekermann-wegener.de/pro/steps.htm Ruhr model: http://www.energiewende-ruhr.de/ http://www.spiekermann-wegener.de/pro/ruhr2050.htm


