Download
1 / 19
190 likes | 195 Views
“OLYMPEX”. November-December 2014. Physical validation Precipitation estimation Hydrological applications. PMM Hydrology Telecon , 22 October 2010. Contributors. W. Peterson R. Cifelli T. Schneider D. Lettenmaier N. Voison N. Schraner J. Lundquist S. Medina S. Brodzik.

E N D
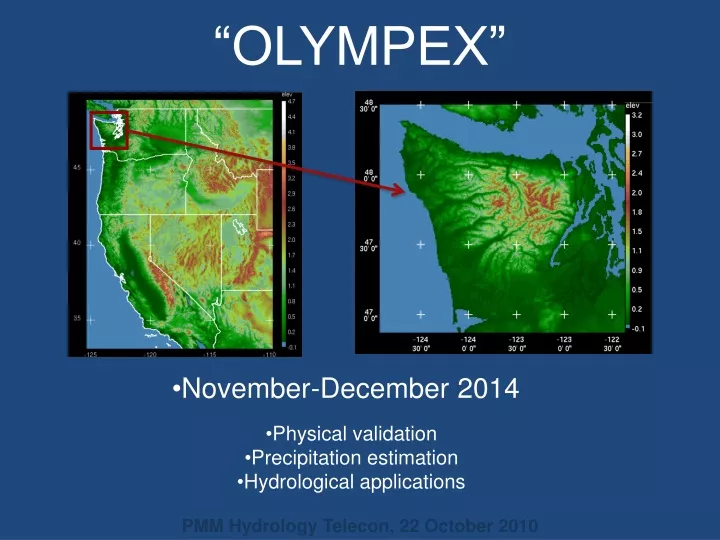
“OLYMPEX” • November-December 2014 • Physical validation • Precipitation estimation • Hydrological applications PMM Hydrology Telecon, 22 October 2010
Contributors • W. Peterson • R. Cifelli • T. Schneider • D. Lettenmaier • N. Voison • N. Schraner • J. Lundquist • S. Medina • S. Brodzik
Maximum The Olympic Peninsula is a“natural laboratory”for precipitation studies Extremely large precipitation accumulation produced as the moist SWly flow impinges on coastal terrain Annual average precipitation (PRISM)
Detailed Climatology 5-yr MM5 Nov-Jan precipitation climatology (mm) Verified by gauges: Minder et al. 2008
Frequency of occurrence 0°C level (km) rain at low elevations, snow at higher levels Low 0ºC level Distribution of Nov-Jan 0°C level for flow that is onshore and moist at low levels (KUIL sounding)Mean 0°C level during storms = 1.5 kmSee this full range in individual storms! Plot provided by Justin Minder
Persistent southwesterly flow during the winter provides a reliable source of moisture NCEP long-term mean sea level pressure (mb) for winter (December to January) and topography
Data from vertically-pointing S-band radar NOAA Mobile Atmospheric River Monitoring System in Westport (since 2009) Signal-to- noise ratio Height Radial velocity Height Time
Detailed gauge network UW fine-scale observing network across a southwestern Olympics ridge Minder et al. 2008
UW Real Time Regional Environmental Modeling (Mass & Lettenmaier) • WRF • Ensemble mode • 1.33 resolution • Data assimilation
UW Real Time Regional Environmental Modeling (Mass & Lettenmaier) Real time hydrological prediction driven by the UW WRF simulations Also—ESRL will be doing parallel modeling
(Global Hawk?) +NSF Facilities!!?? SNOTEL RAWS S-Band profiler Atmos. River Observatory NPOL WSR-88D Quillayute Rawinsonde
(i.e. are physical assumptions in GPM algorithms robust under different conditions) Physical validation of rain and snow retrievals • Rain-snow transition on sloping terrain • Melting layer effect on algorithm performance • Different storm sectors—prefrontal, frontal, postfrontal • Different surface conditions—ocean, land, coast, hills, mountains
Rain and snow measurement(i.e. validation of its accuracy from satellite instruments mounted on aircraft) • Do precipitation measurements transition accurately from • ocean to land • land to mountains? • Do they handle the orographic enhancementof precipitation? • Can satellite rain measurements be downscaled accurately relative to the topography?
Hydrologic applications(i.e. testing whether GPM data can improve streamflow forecasting in complex terrain) • Can satellite rain estimates over hills and mountains provide useful input to real-time hydrologic forecasting? • Does downscaling relative to topography improve hydrologic forecasting? • Can assimilation of satellite rain estimates into regional forecasting models improve hydrological forecasts?
Summary OLYMPEX is a fully integrated GV experiment • Physical validation • Rain and snow measurement • Assimilation of GPM measurements into hydrologic forecasts The climatology, terrain, and existing infrastructure have all the ingredients for hosting an integrated campaign This research was supported by NASA grant NNX10AH70G
