Download
1 / 29
290 likes | 425 Views
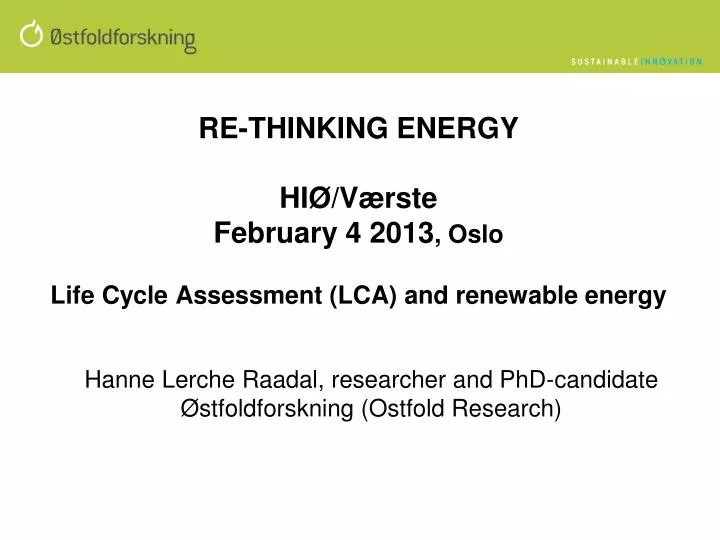
RE-THINKING ENERGY HIØ/ Værste February 4 2013 , Oslo Life Cycle Assessment (LCA) and renewable energy. Hanne Lerche Raadal, researcher and PhD-candidate Østfoldforskning ( Ostfold Research). Short introduction Ostfold Research ( Østfoldforskning ).

E N D
RE-THINKING ENERGY HIØ/VærsteFebruary 4 2013, OsloLife Cycle Assessment (LCA) and renewable energy Hanne Lerche Raadal, researcher and PhD-candidate Østfoldforskning (Ostfold Research)
Short introduction Ostfold Research (Østfoldforskning) • Norwegian research company, localised in Fredrikstad • Number of staff: 20, annual turnover: approx 22 million NOK • Performs applied research and development within Environmental Protection, based on Life Cycle Assessment (LCA) methodology: • Optimal packaging and food products • Energy and waste resources • Constructions and the service sector • Innovation processes • Project examples, energy related: • Energy Trading and Environment 2020 • LCA of gas power, including carbon capture and storage (CCS). Statoil • Energy indicators for electricity production. CEDREN • LCA of power and heat based on biomass resources. NVE
Introduction to LCA Methodology • A system analysis according to ISO 14044 • a systematic survey and assessment of health, environmental and resource effects throughout the whole life cycle of a product, or product system. • Carrying out a Life Cycle Assessment includes: • Identifying the entire life cycle of the product, from raw material extraction, through materials processing, use and disposal at the end of the product's life (from "cradle to grave"). • Identifying and describing the energy and material uses and releases into the environment from all • Processes • Transportation steps • Defining the functional unit (FU) of the analysis, reflecting the product’s function, efficiency and life span.
The lifecycleof a product Example FU: Production, use and waste management (15 years lifespan) Raw material A Raw material B Raw material B Use and maintenance of the product Waste management Extraction and processing of raw materials Production of the product
Impact Assessment of the LCA • Impact assessment is a process where the potential impacts of the resource requirements and environmental loads are characterised and assessed. • Classification = what environmental impacts do the emissions contribute to? • emissions of N2O and CH4 contribute to global warming (just like CO2) • Characterisation = how much is the potential contribution? • N2O and CH4 have a global warming potential that is 298 and 25 times the global warming potential of CO2, respectively.
Inventory Results Characterisation Results SO2 NOx HCl etc. Acidification potential NH3 NOx P etc. Classification Eutrophication potential CO2 CH4 CFCs etc. Global warming potential (kg CO2-equivalents) More characterisation categories. (ref. Hitch Hicker’s Guide to LCA, Baumann H., Tillman A.M.)
Classification and characterisation 1. Resource consumption • Non-renewable energy • Materials • Water • Land use 2. Health impacts • Toxic effects • Occupational Health • Psychosomatic effects 3. Environmental Impacts • Global warming • Ozone depletion • Acidification • Eutrophication (nutrient enrichment) • Photochemical oxidation (smog) • Ecotoxicological effects • Biological diversity 4. Other impacts • Other inputs/outputs
The lifecycleof the generation and useoffuel Extraction and productonoffuel Use stage Life cycle of fuel generation, distribution and use
LCA CO2-emissions from 1 km driving Petrolengines Diesel engines Combustion (engine) Gas engines Production (fuel) g CO2-equiv. / km 2% and 0.5% CH4-loss in the upgradingprocess Fossil Fossil Fossil
The life cycle of the generation and use of electricity Extraction of fuels, production of materials (steel, concrete, etc) Use/consumption of electricity Operation of electricity plant Distribution of electricity Life cycle of electricity generation, distribution and use
LCA CO2emissions from electricity technologies Raadal et al., 2010 * Data collected by Ostfold Research.
Average GHG emissions from Norwegian hydropower • Data based on: • LCAs of electricity generation from 11 Norwegian hydropower stations. • Represents 4.3% of the annual Norwegian hydropower generation (NVE) Modahl and Raadal, 2012
LCA CO2 emissions from electricity technologies Raadal et al., 2010 * Data collected by Ostfold Research.
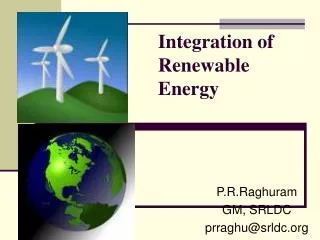
Wind power - development IPCC, 2011: IPCC Special Report on Renewable Energy Sources and Climate Change Mitigation
LCA oftwoNorwegianwindpower farms 17 turbines, each 2.3 MW 5 turbines, each 0.75 MW Poductionof materials (mainlysteel) Kjøllefjord (Statkraft) Fjeldskår (Agder Energi)
1 kWh (11.0 g CO2-eqv.) Reinvestments, nacelle (1.2 g) Roads and constructions (1.0 g) Rotor (3.1 g) Tower (1.9 g) Nacelle (2.6 g) Foundation (0.4 g) Steel Steel Steel Diesel Glass-epoxy Waste treatment • Wind Power Kjøllefjord • Output from LCA software tool (SimaPro)
How to demand and claim specific electricity from a common grid? • Traditionally, the choice of electricity supplier has been based on electricity prices alone • Environmental profile of the consumed electricity based on geographical locations.
Guarantee of Origin (GO): a choice based on the electricity’s origin Tracking system for the electricity’s origin, based on economic transactions.
Electricity Disclosure • The Electricity Market Directive 2009/72/EC, Article 3(9) • All suppliers of electricity are required to disclose their electricity portfolio with regards to: • energy source • environmental impacts, specifying • the emissions of CO2 • the production of radioactive waste • Attributes = The disclosed indicators, representing the environmental information associated with the electricity generation processes. • Aim of Electricity Disclosure: • To provide consumers with relevant information about power generation and to allow for informed consumer choice - not to be based on electricity prices alone. http://www.reliable-disclosure.org/electricity-disclosure/
Guarantee of Origin (GO) • Defined in the Renewable Energy Directive (2009/28/EC) • Shall provide proof to a final customer that a given share or quantity of energy was produced from renewable sources as required by Article 3(6) of Directive 2003/54/EC (repealed by Directive 2009/72/EC, The Electricity Market Directive). • Standard size of 1 MWh • Specific information requirements • Energy source and start and end dates of production • Whether and to what extent the installation has benefited from investment support • Etc. • Applicable for electricity disclosure
Principle of the system • The traditional electricity product divided into two separate products: • The environmental attributes related to the generation of the electricity • The physical electricity being delivered. • GO = Guarantee of Origin GO market Cancellation Regulated system – national authorities responsible for monitoring and account keeping, as well as balancing the electricity generation and relating GOs.
240 TWh • 11 % of the power consumption in corresponding countries • 29 % of European RES generation A growing market Statistics – EECS certificates About 100 TWh from Norway, of which 16 was used in Norway Source: AIB • EECS = The European Energy Certification System • A harmonised system for international trade of Guarantees of Origin (GOs)
Connection GOs and Electricity Disclosure Production Electricity Mix (Country or Region) Customers Electricity Disclosure “Green” customers purchasing GOs • Attributes related to the purchased GOs. “Ordinary” customers, purchasing electricity without any specific requirements • Attributes related to the Production Electricity Mix, corrected by attributes which have been allocated by other tracking systems (e.g. GOs) • = Residual Mix
Norges vassdrags- og energidirektorat (NVE)The Norwegian Water Resources and Energy Directorate
Electricity Disclosure for Norwegian electricity consumers Information about power generation Production Electricity Mix (Country or Region) Customers “Green” customers purchasing GOs “Ordinary” customers, purchasing electricity without any specific requirements
Short summary • LCA gives environmental information about a product’s total value chain, thus not only focusing on separate stages. • The environmental profile of different energy carriers, such as electricity and fuels, depends largely on the primary energy source (bio, wind, hydro, coal, oil, natural gas, etc.). • It is possible to demand specific electricity (by purchasing Guarantees of Origin) even though you are connected to a common electricity grid. • Consumers should always strive to demand environmental preferable products, asking for environmental information from their suppliers.
Thank you for listening! Good luck with today’s work
Avoiding double counting Double counting: Attributes from the same instance of generated electricity are claimed more than once. The attributes relating to the purchased GOs must be excluded from the Residual Mix. EU financed projects, E-TRACK and RE-DISS: Developed a methodology for a pan-European calculation of Residual Mixes. http://www.reliable-disclosure.org/
NorwegianResidualMix 2011 Electricity consumption covered by GOs: 16 TWh (13% of total consumption) 128 TWh Electricity consumption covered by Residual Mix: 109 TWh (87% of total consumption) 22 TWh (21%) 90 TWh ??? Attribute deficit related to 87 TWh 87 TWh (79%) Source: NVE , the 11th of June 2012 http://www.nve.no/no/Kraftmarked/Sluttbrukermarkedet/Varedeklarasjon1/Varedeklarasjon-for-2011/ Source: NVE , before the 11th of June 2012 Source: RE-DISS ,http://www.reliable-disclosure.org