Download
1 / 42
420 likes | 553 Views
Stage-Specific Survivability Prediction Models across Different Cancer Types. Elham Sagheb Hossein Pour 1 and Rohit J. Kate 2 1 Marshfield Clinic Research Institute 2 University of Wisconsin-Milwaukee.

E N D
Stage-Specific Survivability Prediction Models across Different Cancer Types ElhamSagheb Hossein Pour1 and Rohit J. Kate2 1Marshfield Clinic Research Institute 2University of Wisconsin-Milwaukee
Disclaimer: My expertise is in Computer Science and not in Medicine. What you hear in the rest of the talk is not coming from a medical expert.
Cancer • Leading cause of morbidity and mortality worldwide • In 2012*, in the world: • 14 million new cases • 8.2 million deaths • In 2014*, in the US: • 25.12% of total deaths • Second leading cause of death after heart diseases * Latest available data
Machine Learning Applications in Cancer Prediction • Machine learning methods have been widely employed for predicting • Cancer susceptibility • Cancer diagnosis • Cancer recurrence • Cancer survivability • Some researchers have used datasets with detailed clinical and genomic information, but such data is not available to all researchers • Others have used the publicly available dataset called SEER • Very large but less detailed
SEER Cancer Dataset • SEER is National Cancer Institute’s (NCI) Surveillance, Epidemiology, and End Results program http://seer.cancer.gov/ • Information on cancer incidences is collected from areas representing 28 percent of the US population, funded by NCI and CDC
SEER Cancer Dataset • De-identified records of over 9.68 million cancer incidences that occurred between 1973-2014 (2017 release) • Updated data is released every year • 498,698 new incidences in the 2017 release • Available to all for free! • Just needs a signature on a data-use agreement form to download the data
Predicting Cancer Survivability • How is surviving cancer commonly defined? • Being alive five years after diagnosis • Why predict survivability? • Enable healthcare providers to make more informed decisions • For example, opt for more aggressive therapies if ominous prognosis
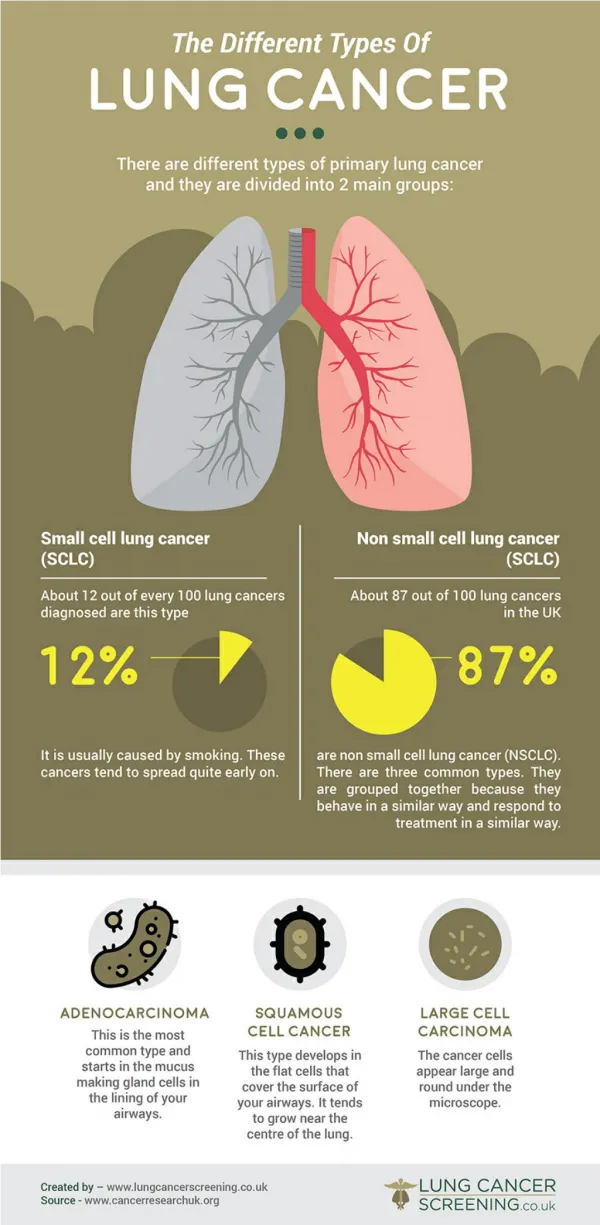
Cancer Types • We built survivability prediction models using three machine learning methods (naïve Bayes, logistic regression, decision trees) for ten most common cancer types in men and women:
How Do Cancer Survivability Predictive Models Work? Logistic regression Decision Trees Naïve Bayes ……. SEER Data Cancer Features Survived? _ _ _ _ _ _ _ _ _ _ _ _ _ _ _ _ _ _ _ _ _ _ _ _ _ _ _ _ _ _ _ _ _ _ _ _ _ _ _ _ _ _ _ _ _ _ _ _ Survival Prediction Cancer Features Predictive Model
SEER Features for Predicting Cancer Survivability(Delen et al. 2005; Bellaachia & Guven 2006; Park et al. 2013; Kim et al. 2013)
SEER Fields to Determine Survivability for Training and Evaluation ifsurvival months ≥ 60 and vital status recode= “alive” thensurvived else ifsurvival months < 60 and cause of death = “cancer type” thennot survived else exclude the patient (died of other cause)
Evaluation Measures • Sensitivity= Out of all who survived what fraction were correctly predicted to survive • Specificity= Out of all who did not survive what fraction were correctly predicted to not survive There is a trade-off between sensitivity and specificity: • Predict everyone to survive: 100% sensitivity but 0% specificity • Predict everyone to not survive: 100% specificity but 0% sensitivity
ROC Curve • Most machine learning methods also give a confidence (or probability) on their prediction • For example, 90% confident will surviveor 75% confident will survive • Using different thresholds on this confidence, different sensitivity and specificity measures can be obtained which are then plotted on a graph called ROC curve • For each threshold, all examples above the threshold are predicted as positives (e.g. survive) and below as negatives (e.g. not survive)
ROC Curve Perfect Predictions Predict everyone to survive Different confidence thresholds Predictive Model Randomly predict 80% to survive Random Baseline Randomly predict 50% to survive Predict everyone to not survive
Area Under ROC Curve (AUC) • One number that summarizes performance of a predictive model • Commonly used for comparing predictive models • Higher the better; perfect AUC = 1.0 • Random baseline has AUC=0.5
Data Used for Experiments • Although SEER data is available since 1973, survivability rates have improved over time • Colorectal: • 48.6% in 1975 • 67.2% in 2013 • Breast: • 75.2% in 1980 • 90.6% in 2013 • Hence it is not a good idea to use very old data to build survivability prediction models • We used data since 2004 • Since survivability is defined for 5 years, we had to also exclude the recent five years of data
Past Work by Other Researchers • Many other researchers have used SEER data to build predictive models for cancer survivability • All of them built one model for all the stages of cancer • Stage of cancer was used only as a feature • Did not distinguish between different stages during training or testing
Stages of Cancer • Cancer incidences are assigned stages based on tumor size and extent of spread • There are more than one staging systems currently in use for cancer • Stage 0, Stage I, Stage II, Stage III, Stage IV, further subcategories • TNM (tumor, node, metastasis) • Summary stages: in-situ, localized, regional, distant Present in SEER; used in this work
Summary Stages • In-situ: Abnormal cells are confined to the layer of cells in which they developed • Localized: Limited to the organ in which it began • Regional: Has spread to nearby lymph nodes • Distant: Has spread to distant lymph nodes, tissues and organs
Survivability Rates of Different Summary Stages of Breast Cancer • Survivability rates vary widely among summary stages • Statistics from the subset of SEER dataset from year 2004 onwards (total 174,518 incidences): Total Incidences Note: With 99.42% survivability rate for in-situ summary stage, prediction for it is almost unnecessary, hence it was excluded from experiments.
Survivability Prediction Models For each cancer type, we built two types of survivability prediction models • Joint Predictive Model: One model trained on all stages • Used by others in past work • Stage-Specific Models: One model trained for each stage • Used in this work
Joint Predictive Model (as used by others in past) Localized Regional Distant Training Data Joint Predictive Model
Stage-Specific Predictive Models(as used in this work) Localized Regional Distant Training Data Training Data Training Data Predictive Model for Localized Predictive Model for Regional Predictive Model for Distant
Evaluation: All Stages vs. Specific Stage Besides training, evaluation can also be done for all stages together and separately for each stage for both types of models
Evaluation of Joint Model • All stages: Simply evaluate on all stages (done in all past work) • Each stage: Evaluate separately on test examples of each stage Localized Regional Distant Testing AUC for all stages Joint Predictive Model Localized AUC for localized Testing Regional AUC for regional Joint Predictive Model Testing Testing AUC for distant Distant
Evaluation of Stage-Specific Models • Each stage: Evaluate each model on its particular stage • All stages: Combine the results of each stage Localized AUC for localized Predictive Model for Localized Testing Regional AUC for regional Predictive Model for Regional Testing AUC for distant Distant Predictive Model for Distant Testing Localized Predictive Model for Localized Testing Regional AUC for all stages Predictive Model for Regional Testing Distant Predictive Model for Distant Testing
AUC Results for Naïve Bayes Model for Breast Cancer All past work reported only this! An overestimation! Worst performance on distant Stage-specific models did better than joint model Bold: statistically significant (p < 0.05, paired t-test)
Why Evaluation on All Stages Together Leads to Overestimation? • Consider a “stage-sort” baselinethat assigns random probabilities but such that: Probability of all Localized > Regional > Distant Random probabilities Random probabilities Random probabilities
Why Evaluation on All Stages Together Leads to Overestimation? • Predict all localized stage patients to survive and the rest to not survive • sensitivity = 0.68, specificity = 0.74
Why Evaluation on All Stages Together Leads to Overestimation? • Predict all distant stage patients to not survive and the rest to survive • sensitivity = 0.99, specificity = 0.124
Why Evaluation on All Stages Together Leads to Overestimation? • Plot ROC curve for stage-sort” baseline on breast cancer data: AUC = 0.726
Why Evaluation on All Stages Together Leads to Overestimation? • Plot ROC curve for “stage-sort” baseline on breast cancer data: AUC = 0.726 • Seemingly reasonable performance can be obtained when evaluating on all stages by exploiting their order of survivability rates!
AUC Results for Stage-Sort Baseline Overestimation!
Evaluating on All Stages Together Leads to Overestimation! • Evaluating predictive models on all stages together as was done in past leads to overestimation! • We found this to be true consistently across all cancer types and all machine learning methods • Predictive models learn to rank localized, regional and distant stages in that order for predicting survivability and thus get an artificial boost in performance • Hence performance should be evaluated separately for each stage
AUC Results for Logistic Regression for Prostate Cancer Bold: statistically significant (p < 0.05, paired t-test)
AUC Results for Decision Trees for Colorectal Cancer Bold: statistically significant (p < 0.05, paired t-test)
AUC Results for Naïve Bayes for Lung Cancer Bold: statistically significant (p < 0.05, paired t-test)
Joint vs. Stage-Specific Models • Even though joint model gets more examples during training it does not do better than stag-specific models • Additional training examples of other stages during training do not help • Results show that the most suitable model to predict survivability for a stage is the model trained only for that stage
Joint vs. Stage-Specific Models • Exceptions (out of ten cancer types each with three stages and all with three methods): When a stage had insufficient number of training examples and other stages did not have very different survivability rates then joint did better than stage-specific • Bladder • Distant (logistic regression) • Esophagus • Distant (logistic regression, decision trees) • Liver • Distant (all methods) • Regional (logistic regression, decision trees) • In these cases including training examples of other stages seem to help
Joint vs. Stage-Specific Models Stage-Specific > Joint Stage-Specific >< Joint
Conclusions • SEER dataset is a great resource for doing informatics related to cancer • There are enough differences between cancer stages that it is better to use stage-specific models to predict survivability instead of joint models as used in the past • Predictive models should be evaluated separately for each stage otherwise leads to overestimating the performance
Thanks! Questions?