Download
1 / 35
350 likes | 509 Views
Late Successional Old Growth (LSOG) the issue, the data, the look. Kenneth M. Laustsen Maine Forest Service 8 th Annual FIA Symposium, Monterey, CA October 18, 2006. Late Successional Old Growth (LSOG). A current policy issue percolating in Maine

E N D
Late Successional Old Growth (LSOG)the issue, the data, the look Kenneth M. Laustsen Maine Forest Service 8th Annual FIA Symposium, Monterey, CA October 18, 2006
Late Successional Old Growth (LSOG) • A current policy issue percolating in Maine • Loads of real concern on status, recent changes, and future distribution by lots of various stakeholders • How to assess? • There are already C&I benchmarks and implications for maintenance in Maine’s State of the Forest Report • Need an unbiased estimator – FIA data?
Discussion Points • The Issue • LSOG definition • Extant • Change Dynamics • The Data • Manomet – Forest Conservation Program • ME Phase 2 • ME Phase 3 • The Look • FVS and SVS
The Issue • Late Successional Old Growth (LSOG) stands are beyond silvicultural or financial maturity, with a dominant canopy cohort of trees 120 – 200 years old. • Deemed to be a integral and desirable component of biodiversity and sustainable forest management. • How to identify? • How to maintain or restore the attributes comprising LSOG?
Manomet – Forest Conservation Program • LS Index – a simple, fast (< 30 minutes), science-based and field-tested tool that foresters can use to identify LSOG. • Built from a large number of variables • Relies on • Density of large-diameter trees (≥ 16”, alive or dead) (Large-tree Score of 0 – 9) • Density of 3 easily-identified lichen species (Lichen Score of 0 – 2) • LS Index = Large-tree Score + Lichen Score • Released in December 2004, with a separate index for Northern Hardwood and Upland Spruce-fir Forests
Cooperation – Round #1 (12/1/04 – 1/28/05) • Manomet approached MFS with the idea of analyzing 1982, 1995, and 2003 FIA data to estimate LSOG acreage. • Manomet reconfigured the LS Index to a single LS Threshold using only the Large-tree Score for each of the Major Forest Type Groups (MFTYP). • MFS retained only single condition plots, therefore any qualified tree (live/dead/snag) had a discrete contribution value (5 or 6 TPA), depending on plot size. • MFS used reprocessed data with single algorithms across time for type, stocking, and stand size. • Presentation made to a LSOG Stakeholder group on January 28, 2005
Conclusions • Minor loss from 16% to 13% of total timberland acreage over the 20 year period, ~500,000 acres • Compensating changes going on • > 83% of acres are in FIA Sawtimber size class. (Expected) • ~70% of acres are in the 60 – 120 year age class based on converting the Best Site Index Tree to a stump age basis. (Unexpected) • Satisfied stakeholders?
Questions and Impacts • Should a recent harvest activity, i.e. since the previous inventory, remove a plot from consideration as LSOG? If yes, then • 1982 retains only 79% - 2.2 MM acres • 1995 retains only 72% - 1.9 MM acres • 2003 retains only 91% - 2.1 MM acres • Should LSOG have a minimum All Live Basal Area of ≥ 100 sq ft? If yes, then • 1982 retains only 72% - 2.0 MM acres • 1995 retains only 65% - 1.7 MM acres • 2003 retains only 79% - 1.8 MM acres
How can forest management retain, recruit, and promote trees to fill this structural gap of 6 – 10 trees that are 16.0”+ DBH?
Cooperation – Round #2 (2/1/05 – 4/27/05) • New primary interest was just in 3 MFTYP’s • White/Red/Jack Pine (100) • Upland Spruce-Fir (120 sub-group) • Maple/Beech/Birch (800) • Large-tree score of 4, 5, 6 was considered Potential LSOG, needing lichens to qualify or more time to add additional stocking • Large-tree score of 7, 8, 9 was considered Prime LSOG, qualifies now on just large trees • Presentation made at “Northeast LSOG Dialogue” on April 27, 2005
Round #2 continued • Hypothesis - Change in sample population over the 20-year period was masking dynamics • Of all plots measured in 1982, only ~50% were retained and remeasured in 1995 • Of all plots measured in 1995, only ~50% were retained and remeasured in 1999 – 2003 • 707 plots were successively remeasured in the 1982, 1995, and 2003 inventories. This subset was expanded to a statewide estimate. • For the 3 MFTYP’s of interest there are 136 plots, qualifying as LSOG (Potential or Prime) at some point in the 20-year period, representing an aggregate of 3.9 MM acres. • What happens to each MFTYP?
Summary • In aggregate, the trajectory of the remeasured plots in estimating LSOG is far different from the 3 sets of inventory plots: • 1982 remeasured plots estimate 20% more acres. • 1995 remeasured plots estimate 15% less acres. • 2003 remeasured plots estimate 36% less acres. • If you were an optimist, you were enthused with the acreage additions growing into or transitioning to other MFTYP and still be LSOG qualified. • If you were a pessimist, the sky was definitely falling. • My thoughts: • Counting just big trees (live/dead/snag) and calling it LSOG, does not bring a lot of analytical comfort. • Averaging the current core plot design may not represent the visual acre • Annualized inventory will improve these transitions • Audience not impressed!
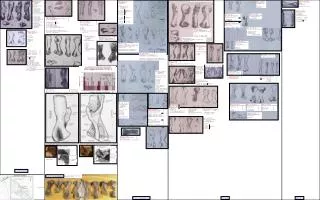
Hardwoods All species Softwoods Figure 78. Estimated number of trees per acre greater than 16.0-inches in diameter at breast height, Maine, 2003. Is this a better way of answering the LSOG extant?
Figure 77. Number of Late-Successional lichen species, Maine, 2003 Or do we promote this approach, using Phase 3 data
The conundrum • For the first time, estimates using plots from separate inventories to infer change did not match up to remeasured plots and their exact estimate of trends and point-in-time inventory levels. • Challenge is how to get agreement on the analytical process before seeing the results? • What to do? • Out loud thinking on the white board! • Or more cooperation
Cooperation – Round #3 (5/1/05 – 4/1/06) Manomet believes in the continuing use of FIA data for calibrating LSOG attributes, therefore - • Manomet revised the LS Index, the new procedure is now based solely on the frequency and stocking of large trees, ≥ 16” DBH, live or dead. • Northern Hardwood and Upland Spruce-fir are correlated to data from known Old Growth, Late Successional, and Silviculturally Mature stands. These two groups constitute 60% of Maine’s forestland. • Manomet and MFS agree that further segregation will be by: • Intact Forestland • Non-intact Forestland • Plots need to have an All Live Basal Area of ≥ 100 sq. ft. to be retained
Round #3 continued • Contemplating setting a hurdle of qualified stocking on the sub-plot level for an implied spatial distribution across visual acre: • At least 1 large tree on at least 3 subplots, or • At least 2 large trees on at least 2 subplots • Using FVS and SVS to model and display the qualified plots. • This analysis has not been done and is in limbo, the parties are reluctant to commit. Manomet is trying to obtain a critical mass of agreement on the process. • Everybody wants FIA data to be the underpinning of calibration and the estimator of choice for statewide LSOG acreage.
Round #4 – WHAT IF? (6/1/06 – Now) • Manomet – A forest stand does not instantly become LSOG, but rather slowly accumulates LS attributes and species over time. That is, being LS is not a black-and-white issue. LS is a matter of degree, and therefore it can be measured. If it can be measured, it can be managed. A corollary is that trees can be removed from a stand without removing all of the LS content. Our research indicates that timber harvesting can be compatible with managing and conserving LS attributes.
Round #4 continued • Manomet supplied MFS with some known LSOG stand data (Non-FIA). • MFS has played what if, removing LSOG trees and others in an effort to retain minimum LSOG stocking. • This initial removal has a stumpage value to the landowner, which they can capture while still maintaining LSOG attributes. • Otherwise in actuality, in the same stand, the landowner can remove stumpage value down to the FPA minimum of 30 BAPA.
Round #4 continued • The game plan is to allow the initial removal to take place, and then find a way to subsidize/underwrite/compensate the landowner so that the second stage doesn’t occur, making the landowner financially whole and forest management neutral on a short term basis on sufficient acres. • The additional twist is using ecosystem services and trying to access funds available for carbon sequestration/offsets. • What does this look like?
Northern Hardwood Initial stand LSOG Value = $1,325 Non-LSOG Value = $1,056 268 MTCO2e Post harvest to FPA Minimum LSOG Value = $86 (Big cull) Non-LSOG Value = $91 99 MTCO2e Post harvest to Minimum LSOG LSOG Value = $0 (Dead Trees count!) Non-LSOG Value = $1,027 136 MTCO2e
Preserving Minimum LSOG • Northern Hardwood • $850 worth of stumpage between Minimum LSOG and FPA Minimum • 37 MTCO2e differential between Minimum LSOG and FPA Minimum • Would you accept $23/MTCO2e today, for preserving LSOG for 20 years? • Or would you accept an annual payment of $87 for next 20 years to leave this minimum LSOG on this acre? • The risk of fire or blowdown; who’s liability?
Upland Spruce-Fir Initial Stand LSOG Value = $688 Non-LSOG Value = $1,095 268 MTCO2e Post harvest to FPA Minimum LSOG Value = $0 Non-LSOG Value = $125 92 MTCO2e Post harvest to Minimum LSOG LSOG Value = $0 (Dead Trees count!) Non-LSOG Value = $285 147 MTCO2e
Preserving Minimum LSOG • Upland Spruce-Fir • $160 in stumpage value between Minimum LSOG and FPA Minimum • 55 MTCO2e differential between Minimum LSOG and FPA Minimum • Would you accept $3/MTCO2e today, for preserving LSOG for the next 20 years? • Or would you accept an annual payment of $16 for next 20 years to leave minimum LSOG on this acre? • The risk of budworm; who’s liability?
Summation – Where we’re at • Consensus is that some distributed level of LSOG is needed. • Change dynamics need to be better addressed, both recruitment and retention. • How best to reimburse a landowner for retaining or even self-perpetuating LSOG? • FIA data is the metric to use; its trusted, unbiased, scalable, and in-place. • How to use FIA data and reach a consensus without resorting to a “Referendum”. • Need for better modeling tools to predict recruitment, retention, and fall-down in pre and LSOG sized trees. • Triple Bottom Line (Financial, Social, Environment)?
Stay Tuned Questions?