Download
1 / 23
240 likes | 626 Views
A Carbon footprint analysis of plastic bags. A review of the Life Cycle Analysis on Carrier Bags – UK Environment Agency. July 2011. Background. In February 2011, The UK Environment Agency published a report, Life Cycle Analysis on Carrier Bags.

E N D
A Carbon footprint analysis of plastic bags A review of the Life Cycle Analysis on Carrier Bags – UK Environment Agency July 2011
Background In February 2011, The UK Environment Agency published a report, Life Cycle Analysis on Carrier Bags. • -An assessment across all types of carrier bags • Conventional plastic • Hydro-biodegradable plastic • Oxo-biodegradable plastic • Cotton/Jute • Paper 2
Carbon Footprint of Plastic Bags The UK Environment Agency study shows how plastic bags* are the most environmentally friendly. If these were banned, it would actually be worse for the environment as the alternatives to plastic bags have a higher Global Warming Potential. *Conventional HDPE plastic bag Source: UK Environmental Agency
CO2 impact of carrier bags Everyday actions compared to bags = Average daily car trip1 1 781 bags = 137,000 bags Long haul flight2 1 1Based on: 30 mile trip, 12,000 miles per year, 2008 Ford Focus 1.6 (10kg CO2) 2Based on: Return flight from London Heathrow to Hong Kong (1,750kg CO2) 4
Global Warming Potential The following shows the GWP of different carrier bags, made from a variety of materials 5
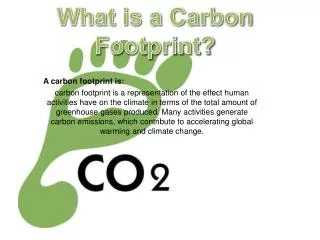
Global Warming Potential What is it? Global Warming Potential (GWP) gives an indication of gas release which contributes to global warming • Examples of Global Warming Gas: • Water vapour • Carbon dioxide • Methane • Nitrous oxide • Others
Global Warming Potential Comparison: plastic bags and other bags How many times do you need to re-use one of these bags to have the same GWP? Source: UK Environmental Agency 2011
Global Warming Potential Comparison: plastic bags and other bags If carrier bags are re-used (as most of them are), the impact on the environment is greatly reduced. Kg/CO2 equivalency *Unlikely to be achievable due to the type of material used.
Global Warming Potential Total CO2 impact of different carrier bags Bag weight: 8.12g
Global Warming Potential Total CO2 impact of different carrier bags Bag weight: 8.27g
Global Warming Potential Total CO2 impact of different carrier bags Bag weight: 16.49g *The CO2 released from bio-degradation is the same as that absorbed by the crop during its growing cycle.
Global Warming Potential Total CO2 impact of different carrier bags Bag weight: 55.2g *The CO2 released from bio-degradation is the same as that absorbed by the crop during its growing cycle.
Global Warming Potential Total CO2 impact of different carrier bags Bag weight: 34.94g
Global Warming Potential Total CO2 impact of different carrier bags Bag weight: 115.83g
Global Warming Potential Total CO2 impact of different carrier bags Bag weight: 120g
Global Warming Potential Total CO2 impact of different carrier bags Bag weight: 183.11g *The CO2 released from bio-degradation is the same as that absorbed by the crop during its growing cycle.
Global Warming Potential Total CO2 impact of different carrier bags Bag weight: 183.11g *The CO2 released from bio-degradation is the same as that absorbed by the crop during its growing cycle.
Global Warming Potential Total CO2 impact of different carrier bags Bag weight: 183.11g *The CO2 released from bio-degradation is the same as that absorbed by the crop during its growing cycle.
Other comparisons Other ways to consider the impact Paper vs Plastic Paper bags have a much higher level of impact on the environment compared to plastic bags. Source: Peer Reviewed Published data: Franklin Associates, David Cornell, et al. US Environmental Protection Agency. Questions about your Community Shopping Bags: Paper or Plastic DOE Energy Information Administration
True or False about bags Myths and facts on plastic carrier bags
The way forward • Plastic is • useful, light, flexible and durable • relatively cheap to manufacture • a by-product of oil • oil reserves are still abundant • But to limit its impact on the environment, users can: • reuse plastic objects • reduce the amount of plastic required • recycle • incinerate to recover the calorific value • use a biodegrading additive
Symphony Environmental Ltd info@d2w.net www.d2w.net