Download
1 / 42
420 likes | 632 Views
Significant Figures. Part I: An Introduction. Objectives. When you complete this presentation, you will be able to distinguish between accuracy and precision determine the number of significant figures there are in a measured value. Introduction. Chemistry is a quantitative science.

E N D
Significant Figures Part I: An Introduction
Objectives • When you complete this presentation, you will be able to • distinguish between accuracy and precision • determine the number of significant figures there are in a measured value
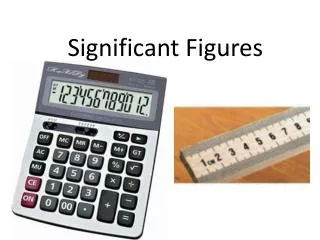
Introduction • Chemistry is a quantitativescience. • We make measurements. • mass = 47.28 g • length = 14.34 cm • width = 1.02 cm • height = 3.23 cm
Introduction • Chemistry is a quantitativescience. • We make measurements. • We get lots of numbers. • We use those numbers to calculatethings. • volume = length × width × height
Introduction • Chemistry is a quantitativescience. • We make measurements. • We get lots of numbers. • We use those numbers to calculatethings. • volume = 14.34 cm × 1.02 cm × 3.23 cm
Introduction • Chemistry is a quantitativescience. • We make measurements. • We get lots of numbers. • We use those numbers to calculatethings. • volume = 47.244564 cm3
Introduction • Chemistry is a quantitativescience. • We make measurements. • We get lots of numbers. • We use those numbers to calculatethings. • volume = 47.244564 cm3 • density = mass ÷ volume
Introduction • Chemistry is a quantitativescience. • We make measurements. • We get lots of numbers. • We use those numbers to calculatethings. • volume = 47.244564 cm3 • density = 47.28 g ÷ 47.244564 cm3
Introduction • Chemistry is a quantitativescience. • We make measurements. • We get lots of numbers. • We use those numbers to calculatethings. • volume = 47.244564 cm3 • density = 1.000750055 g/cm3
Introduction • Chemistry is a quantitativescience. • We make measurements. • We get lots of numbers. • We use those numbers to calculatethings. • density = 1.000750055 g/cm3
Introduction • Chemistry is a quantitativescience. • We make measurements. • We get lots of numbers. • We use those numbers to calculatethings. • density = 1.000750055 g/cm3 • What do these numbers mean? • Do we really know the density to the nearest 0.000000001 g/cm3 (= 1/1,000,000,000 g/cm3)?
Accuracy and Precision • Accuracy and precision are often used to mean the same thing. • We expect that an accuratemeasurement is a precise measurement. • Likewise, we expect that a precisemeasurement is an accurate measurement. • They are related, but they are not the same thing.
Accuracy and Precision • The accuracy of a series of measurements is how close those measurements are to the “real” value. • The “real” value of a measurement is usually the value acceptedby scientists. • It is usually based on a large number of measurements made by a large number of researchers over a long period of time.
Accuracy and Precision • The accuracy of a series of measurements is how close those measurements are to the “real” value. • An example of accuracy is how close you come to the bullseye when shooting at a target. • Accurate shots come close to the bullseye. • Less accurate shots miss the bullseye.
Accuracy and Precision • The precision of a series of measurements is how close the measurements are to each other. • Precise shots come close to each other. • Non-precise shots are not close to each other. • Which group has a greater accuracy? • The less precise group has a greater accuracy.
Accuracy and Precision • When we are making a new measurement, we want to be as precise as possible. • We also want to be accurate, but usually our measurement devise is already accurate. • In most cases, inaccuracyin chemistry labs is due to misreadingthe instrument.
Accuracy and Precision • When we are making a new measurement, we want to be as precise as possible. • Normally, we increase precision by making manymeasurements. • Then, we averagethe measurements.
Accuracy and Precision • Example 1: • Ahab determines the density of a metal several times. • His measurements are: 7.65 g/cm3, 7.62 g/cm3, 7.66 g/cm3, and 7.63 g/cm3. • He reports his average density as 7.64 g/cm3.
Accuracy and Precision • Example 1: • Brunhilda determines the density of a metal several times. • Her measurements are: 7.82 g/cm3, 8.02 g/cm3, 7.78 g/cm3, and 7.74 g/cm3. • She reports her average density as 7.84 g/cm3.
Accuracy and Precision • Example 1: • Who is the most accurate? • Accuracy is related to how close you are to the accepted value. The accepted value is 7.84 g/cm3.
Accuracy and Precision • Example 1: • Who is the most accurate? • Ahab’s data gives a value 0.20 g/cm3 from the accepted value. The accepted value is 7.84 g/cm3.
Accuracy and Precision • Example 1: • Who is the most accurate? • Brunhilda’s data gives a value the same as the accepted value. The accepted value is 7.84 g/cm3.
Accuracy and Precision • Example 1: • Who is the most accurate? • Therefore, Brunhilda is the most accurate. The accepted value is 7.84 g/cm3.
Accuracy and Precision • Example 1: • Who is the most precise? • Ahab’s data varies from 7.62 to 7.66 g/cm3 - a spread of 0.04 g/cm3. The accepted value is 7.84 g/cm3.
Accuracy and Precision • Example 1: • Who is the most precise? • Brunhilda’s data varies from 7.74 to 8.02 g/cm3 - a spread of 0.28 g/cm3. The accepted value is 7.84 g/cm3.
Accuracy and Precision • Example 1: • Who is the most precise? • Ahab’s data was the most precise. The accepted value is 7.84 g/cm3.
Significant Figures • But, what does this have to do with significant figures? • EVERYTHING!
Significant Figures • The measurements we use in our calculations have a built-in precision. • When we find that the mass of an object is 47.28 g, we are saying that we know the mass of the object to a precision of 0.01 g (1/100 g). • So, we know the mass to be • (4×10) g + (7×1) g + (2×0.1) g + (8×0.01) g • We know the mass to 4 significant figures. 1 2 3 4
Significant Figures • The measurements we use in our calculations have a built-in precision. • When we find that the mass of an object is 47.28 g, we are saying that we know the mass of the object to a precision of 0.01 g (1/100 g). • In the same way, we measure the length (14.34 cm), width (1.02 cm), and height (3.23 cm) to a precision of 0.01 cm. • We know the lengthto 4 significant figures.
Significant Figures • The measurements we use in our calculations have a built-in precision. • When we find that the mass of an object is 47.28 g, we are saying that we know the mass of the object to a precision of 0.01 g (1/100 g). • In the same way, we measure the length (14.34 cm), width (1.02 cm), and height (3.23 cm) to a precision of 0.01 cm. • We know the widthto 3 significant figures.
Significant Figures • The measurements we use in our calculations have a built-in precision. • When we find that the mass of an object is 47.28 g, we are saying that we know the mass of the object to a precision of 0.01 g (1/100 g). • In the same way, we measure the length (14.34 cm), width (1.02 cm), and height (3.23 cm) to a precision of 0.01 cm. • We know the heightto 3 significant figures.
Significant Figures • It should be simple to tell how many significant figures there are in a measurement. • For example: if we measure the length of the room to be 14 meters, we have 2 significant figures. • But 14 m = 1400 cm • 1400 cm has 4 digits • It still has only 2 significant figures.
Significant Figures • It should be simple to tell how many significant figures there are in a measurement. • For example: if we measure the length of the room to be 14 meters, we have 2 significant figures. • And, 14 m = 0.014 km • 0.014 has 4 digits • It still has only 2 significant figures.
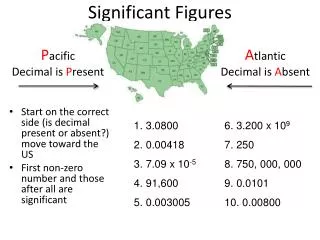
Significant Figures • We have rules for determining the number of significant figures in a measurement. • There is an easy way to determine the number of significant figures in a measurement. • We convert the number to scientific notation, and count the number of significant figures. 450,000 = 4.5 × 10⁵ ➠ 2 significant figures
Significant Figures • We have rules for determining the number of significant figures in a measurement. • There is an easy way to determine the number of significant figures in a measurement. • We convert the number to scientific notation, and count the number of significant figures. 0.03552 = 3.552 × 10⁻² ➠ 4 significant figures
Significant Figures • We have rules for determining the number of significant figures in a measurement. • There is an easy way to determine the number of significant figures in a measurement. • We convert the number to scientific notation, and count the number of significant figures. 14 = 1.4 × 101 ➠ 2 significant figures
Significant Figures • We have rules for determining the number of significant figures in a measurement. • There is an easy way to determine the number of significant figures in a measurement. • We convert the number to scientific notation, and count the number of significant figures. 1,400 = 1.4 × 10³➠ 2 significant figures
Significant Figures • We have rules for determining the number of significant figures in a measurement. • There is an easy way to determine the number of significant figures in a measurement. • We convert the number to scientific notation, and count the number of significant figures. 0.014 = 1.4 × 10⁻²➠ 2 significant figures
Significant Figures • We have rules for determining the number of significant figures in a measurement. • There is an easy way to determine the number of significant figures in a measurement. • We convert the number to scientific notation, and count the number of significant figures. 13.0 = 1.30 × 101➠ 3 significantfigures
Significant Figures • We have rules for determining the number of significant figures in a measurement. • There is an easy way to determine the number of significant figures in a measurement. • We convert the number to scientific notation, and count the number of significant figures. 0.004200 = 4.200 × 10⁻³➠ 4 significantfigures
Examples • How many significant figures are in each of the following numbers? • 4,210 m • 0.0002543 s • 5,100,000 kg • 0.745 mL • 4.324 cm • 0.00700 L 4.21×10³ m ➠ 3 significant figures 2.543×10⁻⁴ s ➠ 4 significant figures 5.1×10⁶ kg ➠ 2 significant figures 7.45×10⁻¹ mL ➠ 3 significant figures 4.324×100 cm ➠ 4 significant figures 7.00×10⁻³ L ➠ 3 significant figures
Summary • Accuracy relates to how close a value is to an accepted value. • Precision relates to how close individual measurements are to each other. • Significant figures are a measure of the precision of our measurements.