Download
1 / 1
10 likes | 157 Views
The Statistical Urban Zoning. The Experience of the Municipality of Firenze La zonizzazione statistica in ambito urbano. L’esperienza del Comune di Firenze. Andrea Giommi (1) , Alessandra Petrucci (1) , Riccardo Innocenti (2)

E N D
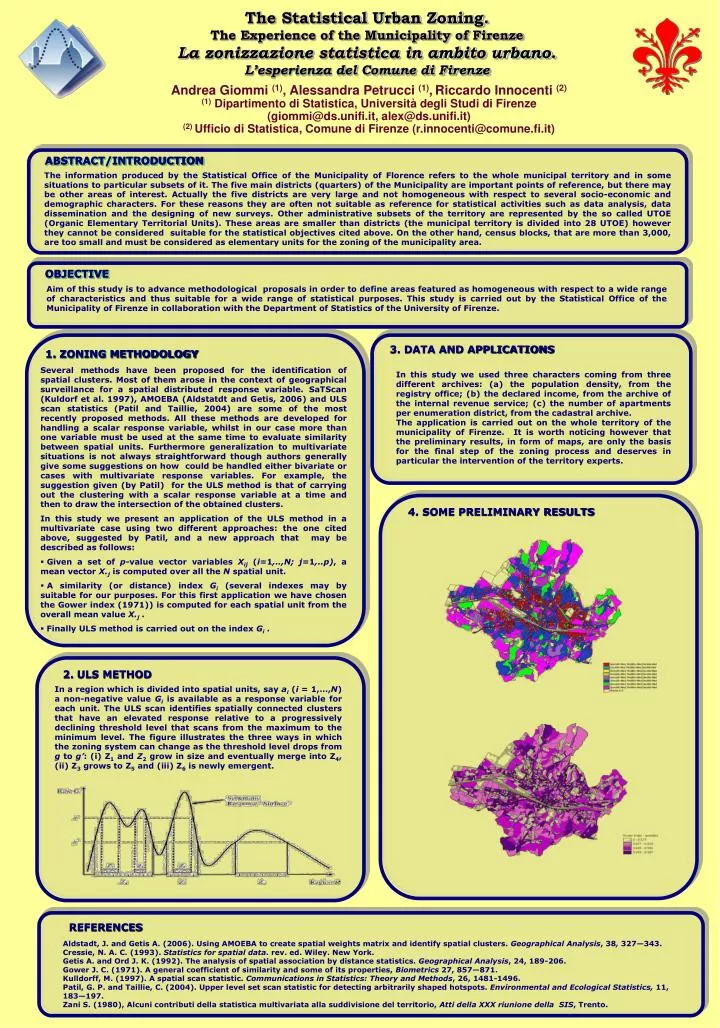
The Statistical Urban Zoning. The Experience of the Municipality of Firenze La zonizzazione statistica in ambito urbano. L’esperienza del Comune di Firenze Andrea Giommi (1), Alessandra Petrucci (1),Riccardo Innocenti (2) (1) Dipartimento di Statistica, Università degli Studi di Firenze (giommi@ds.unifi.it, alex@ds.unifi.it) (2) Ufficio di Statistica, Comune di Firenze (r.innocenti@comune.fi.it) ABSTRACT/INTRODUCTION The information produced by the Statistical Office of the Municipality of Florence refers to the whole municipal territory and in some situations to particular subsets of it. The five main districts (quarters) of the Municipality are important points of reference, but there may be other areas of interest. Actually the five districts are very large and not homogeneous with respect to several socio-economic and demographic characters. For these reasons they are often not suitable as reference for statistical activities such as data analysis, data dissemination and the designing of new surveys. Other administrative subsets of the territory are represented by the so called UTOE (Organic Elementary Territorial Units). These areas are smaller than districts (the municipal territory is divided into 28 UTOE) however they cannot be considered suitable for the statistical objectives cited above. On the other hand, census blocks, that are more than 3,000, are too small and must be considered as elementary units for the zoning of the municipality area. OBJECTIVE Aim of this study is to advance methodological proposals in order to define areas featured as homogeneous with respect to a wide range of characteristics and thus suitable for a wide range of statistical purposes. This study is carried out by the Statistical Office of the Municipality of Firenze in collaboration with the Department of Statistics of the University of Firenze. 3. DATA AND APPLICATIONS 1.ZONING METHODOLOGY • Several methods have been proposed for the identification of spatial clusters. Most of them arose in the context of geographical surveillance for a spatial distributed response variable. SaTScan (Kuldorf et al. 1997), AMOEBA (Aldstatdt and Getis, 2006) and ULS scan statistics (Patil and Taillie, 2004) are some of the most recently proposed methods. All these methods are developed for handling a scalar response variable, whilst in our case more than one variable must be used at the same time to evaluate similarity between spatial units. Furthermore generalization to multivariate situations is not always straightforward though authors generally give some suggestions on how could be handled either bivariate or cases with multivariate response variables. For example, the suggestion given (by Patil) for the ULS method is that of carrying out the clustering with a scalar response variable at a time and then to draw the intersection of the obtained clusters. • In this study we present an application of the ULS method in a multivariate case using two different approaches: the one cited above, suggested by Patil, and a new approach that may be described as follows: • Given a set of p-value vector variables Xij(i=1,..,N; j=1,..p), a mean vector X.j is computed over all the N spatial unit. • A similarity (or distance) index Gi (several indexes may by suitable for our purposes. For this first application we have chosen the Gower index (1971))is computed for each spatial unit from the overall mean value X.j . • Finally ULS method is carried out on the index Gi . In this study we used three characters coming from three different archives: (a) the population density, from the registry office; (b) the declared income, from the archive of the internal revenue service; (c) the number of apartments per enumeration district, from the cadastral archive. The application is carried out on the whole territory of the municipality of Firenze. It is worth noticing however that the preliminary results, in form of maps, are only the basis for the final step of the zoning process and deserves in particular the intervention of the territory experts. 4. SOME PRELIMINARY RESULTS 2.ULS METHOD In a region which is divided into spatial units, say ai(i = 1,…,N) a non-negative value Gi is available as a response variable for each unit. The ULS scan identifies spatially connected clusters that have an elevated response relative to a progressively declining threshold level that scans from the maximum to the minimum level. The figure illustrates the three ways in which the zoning system can change as the threshold level drops from g to g’: (i) Z1 and Z2 grow in size and eventually merge into Z4, (ii) Z3 grows to Z5 and (iii) Z6 is newly emergent. REFERENCES Aldstadt, J. and Getis A. (2006). Using AMOEBA to create spatial weights matrix and identify spatial clusters. Geographical Analysis, 38, 327—343. Cressie, N. A. C. (1993). Statistics for spatial data. rev. ed. Wiley. New York. Getis A. and Ord J. K. (1992). The analysis of spatial association by distance statistics. Geographical Analysis, 24, 189-206. Gower J. C. (1971). A general coefficient of similarity and some of its properties, Biometrics 27, 857—871. Kulldorff, M. (1997). A spatial scan statistic. Communications in Statistics: Theory and Methods, 26, 1481-1496. Patil, G. P. and Taillie, C. (2004). Upper level set scan statistic for detecting arbitrarily shaped hotspots. Environmental and Ecological Statistics, 11, 183—197. Zani S. (1980), Alcuni contributi della statistica multivariata alla suddivisione del territorio, Atti della XXX riunione della SIS, Trento.