Download
1 / 47
470 likes | 476 Views
This article discusses the challenges in measuring and improving quality in medical imaging, including the current areas of interest in VIHA. It also explores the potential gains that can be achieved through novel electronic systems and improved productivity.

E N D
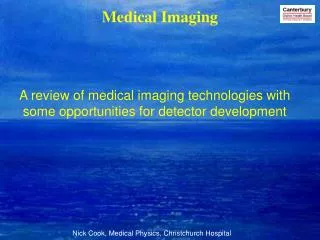
Measuring and Improving Quality in Medical Imaging John Mathieson MD Bob Clark VIHA
Measuring and Improving Quality in Medical Imaging Current Areas of Interest in VIHA and Overall Perspective
Measuring and Improving Quality in Medical Imaging • Huge potential gains • Many current problems • Hard to Measure, Hard to Improve • Expensive
Current areas of interest • Typical Report Accuracy analysis – CT Virtual Colonoscopy Project • Novel Electronic Systems • Report Turn-around Time - Productivity
Current areas of interest • Report accuracy– how to measure? • Manual method • Expensive • Time consuming • Not done routinely • Current project – CT Virtual Colonoscopy – Endoscopic Pathologic correlation
Measuring Work Quality Polyps called at CT VC – • What is found at Colonoscopy / Pathology? Hire someone to track down clinical follow-up and correlate Traditional statistics – PPV NPV etc Not ordinary part of work Special Project
Current areas of interest • Both the Imaging reports and the final diagnoses end up computerized – • BUT – no method of automatic linking and feedback • Ideally – all reports cases with some kind of proof would feed back to original reports
Other Questions – How many cases do new readers need to be qualified to read CT VC? • Wild guess • Nice sounding round number • Actual Data • Measure accuracy vs experience • Subjective self assessment
CT VC Reader Assessment Testing on unknown cases at various points in experience Subjective – ask all readers to describe their own experience with retrospective recommendations
Potential for Electronic Systems • Commissure – voice recognition for Intelligent text analysis • Categorize reports automatically – positive / negative, other • Correlate with – Indications / History - Referring MD
Industry Overview • Radiology is wrestling with optimizing the appropriate use of imaging, spiraling costs, decreasing reimbursements, and its role in improving patient outcomes. • Over 1 billion radiology exams performed each year in US • Fastest growing component of medical costs • Compound annual growth rate (CAGR) of 20% • Over $100 billion in annual US diagnostic imaging costs
Overview: Technology Background • Appropriateness database consisting of over 11,000 rules based on patient demographics and covering MRI, MRA, Breast MR, CT, CTA, PET/CT and Cardiac Stress Testing • Foundation based on ACR Appropriateness Criteria® – expanded to cover broader range of imaging procedures – with input from over 1500 clinicians at MGH/Harvard • Exclusive license agreement for rules database • Utility score (1-9) appropriateness ratings
Overview: Decision Support Utility Score • The appropriateness scores range from 1-9 and are associated with the following relevance: • Indicated (7-9): indicates the desired exam is appropriate given the indications • Marginal (4-6): while the desired exam may yield results, a more appropriate exam may exist • Low (1-3): indicates the exam is less than optimal and more appropriate imaging techniques should be considered
Real World Case: Massachusetts General Hospital • Low-utility (inappropriate) exams decreased significantly, from 11% of the total CT volume before implementation to 4% by the end of the study period.
Real World Case: Massachusetts General Hospital • The portion of high-utility (appropriate) CT exams rose significantly, from 86% before implementation to 93% afterreferrers learned to use the system. The trend was the same for MR.
Real World Case: Massachusetts General Hospital • Overall CT and MR utilization was also affected. CT use rose at an average 4% in each quarter from 2001 to 2003. The curve flattened after implementation, reflecting slowed growth. Again, a similar trend was seen for MR volume. • Positive findings in radiology reports increased from 74% to 84% for CT and 73% to 85% for MR.
Total Outpatient High Cost Imaging Volume Trends Radiology DS Implementation
Fully integrated from Order Entry to Results Analysis – Results – feed back on ordering criteria
Possibilites for Data Analysis / Quality Measurement • Front end • Back End • Linking Front End with Back End • Ordering physician audit • Audit by Indication • Audit by radiologist
Turn Around Time – Productivity • Many steps involved – one of which is - Once study completed – how fast to dictation and sign off? • Extremely variable Under 24 hours to Over 1 week • Problems with slow turn around • Delayed treatment decisions • Longer hospital stays • Extra work created – phone reports etc
3 Kinds of Workers Turtles Racehorses Everyone Else
Turtles Slow, steady, very attentive to detail, unhappy with change and pressure, miss very little
Everybody Else Sometimes fast, sometimes slow Distractible, curious, intelligent Easily bored - “Focus-able”
What can you modify ? Speed of reporting Quality of reporting Time spent reporting vs other things Work hours Distribution of work Easy things Hard things
Everyone Good, conscientious people Proud of their work At least some degree of : people pleasing need ego insecurity competitiveness
Versions of the TRUTH People WILL shirk work they don’t like People WILL get away with things What you don’t count and measure will hurt you
Your co workers are extremely good people You are lucky to work with them Collegial competitiveness is better than cut-throat aggression Versions of the TRUTH
Observer Effect • It is impossible to accurately measure anything, because the act of measuring affects the answer • Thermometer to measure absolute zero- the thermometer warms up the room BAD THING – or GOOD THING ? Why not try to MAXIMIXE the observer effect to get the Maximum change in the answer?
Count and Measure Study Report Status - Statistics Generator Report from 01/12/2007 to 01/13/2007 +=+=+=+=+=+=+=+=+=+=+=+=+=+=+=+= Date: Sat Jan 13 03:45:03 2007 Total Results Dictated: 1001 Total Results Transcribed: 959 Radiologist Results Dictated ----------- ---------------- rjsmith 46 dshea 15 vvanraalte 56 nfinn 110 forkheim 126 dzacks 114 brlee 55 jmathies 123 dconnell 91 cvwinc 11 dchu 61 jwrinch 67 iweir 42 goodacre 24 whodgins 60
Problems Racehorses vacuumed up everything Others began to relax Racehorses started to get annoyed
Basic Minimum - Quota Consensus on a reasonable amount of work for each rotation Background vs Variable Work Example – US and General Do all the US at that location Plus – X number of Radiographs
Results • Dramatic reduction in turnaround time • Actual measurement VGH – 67% • Dramatic shift in time of day work is done • Feelings of fairness, equity and group harmony Unexpected Result Speed with which expectations changed
Quality in Medical ImagingAreas of Concern Access for Patients Access to Information Image Quality Patient Safety Report Accuracy Report Delivery
Access for Patients • Lack of access – wrong dx, unnecessary surgery, wrong surgery, untreated conditions • Wrong test – right test hard to get – do inferior test • Economic models – Activity based funding vs Block Funding • Spend budget wisely – justify expenditures • $100,000 is equivalent to 12,500 extra CT scans ! • A BIG Problem
Access to Information • Integrated PACS / RIS / HIS systems • Integrated into community offices • “Middleware” – functionality Host of benefits – accurate timely info - appropriate tests, no uneccessary repeats, right test first time, timely delivery important results
Access to InformationProblems Access Security • Slow implementation of systems • Expen$ive • Privacy / Security Concerns • Often the balance between Access and Security is Skewed by Paranoia over security
Image Quality • Equipment replacement – inventory maintenance – no financial model • Single year purchases with wildly fluctuating amounts • Chronic inability to replace worn out equipment • “Normal” to have some equipment running that is not safe or diagnostic
Traditional DAP role – Radiation dose vs Image Quality • Sad truth – long history of operating poor quality equipment due to lack of funding • What should be done? Put some teeth into DAP • close down unsafe equipment • change funding model
Summary • Many areas to focus on – beyond traditional scope • Clever use of electronic systems can make quality improvement more practical and routine Access for Patients Access to Information Image Quality Patient Safety Report Accuracy Report Delivery