Download

1 / 18
180 likes | 315 Views
CIA 4U0 – Graphs et al. Mr. T Dot. Production-Possibilities Curve ( aka “Tim Horton's concept). A graph that shows the maximum amount of two goods that can be produced at this point, assuming that all resources are used efficiently. Consider the following table… .

E N D
CIA 4U0 – Graphs et al Mr. T Dot
Production-Possibilities Curve ( aka “Tim Horton's concept) A graph that shows the maximum amount of two goods that can be produced at this point, assuming that all resources are used efficiently. Consider the following table…
Alternative combinations of corn and spears produced in one yr. OPTION CORN SPEARS (Bushels) (not Britney!) A 0 30 B 20 25 C 50 20 D 85 10 E 100 0 Plot the graph showing all letters
Analysis of PPC ØA to E represents the maximum - anything to the left of the curve is attainable • A point to the right of the curve is attainable with an increase in resources • A point to the extreme right of the curve s unattainable • Any point to the far left of the curve represents a waste in resources….a reason why businesses fail
Law of Diminishing Returns - Introduced by English Economist, Thomas Malthus - Argued that the population of the world would increase geometrically (1, 2, 4, 8) whereas food production would increase arithmetically (1, 2, 3, 4), Predicted that world would run out of food.
Inverse relationships Used in graphs. When one variable rises, the other falls. Compose a list of five products where when something goes up, the other will go down and vice-versa (clue: think weather) Now…..take a look at the table on the following slide..
Table showing relationship between bicycles sold and price PRICE BICYCLES SOLD $200 10 $250 15 $300 20 $350 25 $400 30 Plot the graph; price on y; quantity sold on x; note direction of curve
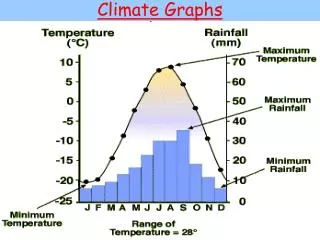
Positive relationship Also used in graphs. Occurs when increase or decrease in one variable results in corresponding increase or decrease in other variable. Consider the following table showing the relationship between centimetres of rainfall and umbrellas sold
Umbrellas and rain table MONTH CMS RAIN BROLLIES SOLD APRIL 5 25 MAY 3 20 JUNE 2 10 JULY 1 5 AUGUST 2.5 15 SEPTEMBER 1.5 3
Positive relationship graph Plot the graph; umbrellas sold on y and cms of rain on x. Note the direction
LDR – Part B (aka Tim Horton Concept) Created by Malthus; when a fixed resource is combined with increasing amounts of a variable resource, a point is reached in which total output (per unit) will become smaller and smaller...e.g.: Shirin’sShawarma Shop.
Law of increasing returns to scale Theory that helps to explain LDR even further. Tells us what happens when all productive resources are used simultaneously. In theory? Maximum production and efficiency; in practice? You know the answer
Infrastructure The basic capital assets of a nation essential for economic growth. This includes roads, railways, hydro, water, transit, schools, colleges and universities. It is often referred to as the “sexy” word in Eco because political parties like to use it as part of an election manifesto.
Law of Comparative Advantage Theory involving the capacity of one nation to produce a good or service with comparatively fewer resouces than another – in other words involving a lower OC. Created by Economist David Ricardo two hundred years ago. E.g: It is cheaper for the U.S to grow oranges than Canada but cheaper for Canada to
LCA (continued)/Law of Absolute Advantage Produce cloth than Portugal. LAA – Created by Economist Adam Smith. The ability of a country to produce more of a good than its competitor because of the unique resources it possesses. E.g: Israel (oranges), South Africa (diamonds), Greece (bauxite), New Zealand (wool)
Canada’s political parties and the economy Each party represents different ends of the economic spectrum. From left to right it is (theoretically).. 1. pure command 2. mixed command 3. mixed market 4. free market
Parties and economy in Canada In Canada, this translates to the following: Communist (mc) Marxist-Leninist (mc) NDP (MC/MM) Liberal (mm) PC (mm) Social credit (mm)
Parties and economy in Canada Reform party (mm/fm) Libertarian (fm)