Download
1 / 21
220 likes | 236 Views
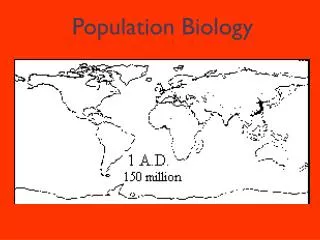
Population Biology. AP Biology. Image taken without permission fron http://www.earthinstitute.columbia.edu/e-newsletter/2003/april03/SLElephantbyWater.jpg. How do you measure population size?. Count all individuals Estimate population size by taking average density.

E N D
Population Biology AP Biology Image taken without permission fron http://www.earthinstitute.columbia.edu/e-newsletter/2003/april03/SLElephantbyWater.jpg
How do you measure population size? • Count all individuals • Estimate population size by taking average density
How do you measure population size? • Mark-Capture Method • Capture a set # of individuals (ex. 100) and tag them • Set them free • Return later and capture the same number of individuals (100) • Determine how many in the second group are tagged divide original # tagged by the number captured that are tagged the 2nd time • Multiply this ratio by original # tagged (100) to determine actual population
Example problem • How many squirrels are living in McClellan Ranch Park? • First time: 100 squirrels captured and tagged • Second time: 100 squirrels captured, 50 are tagged • What is the actual squirrel population size?
Solution • Original population tagged = 100 • Ratio = 100 total / 50 tagged = 2 (this means for every squirrel you tagged there was another one you didn’t tag) • 100 x 2 = 200 The actual population is 200 squirrels
One more practice problem Determine the number of seagulls at Moonstone beach using the mark-capture method • 150 seagulls captured and tagged at Moonstone Beach then set free • 6 months later, another 150 are captured, this time 100 of them are already tagged. • What is the actual seagull population size?
Solution • Original population = 150 • Ratio = 150 total/ 100 tagged = 1.5 (or 3/2) • Actual population = 150 x 1.5 = 225 seagulls
Question… • What are the limitations of the mark capture method? What assumptions have to be true for it to work? • Animals may learn to avoid trap the 2nd time • Assumption: All animals in population are equally likely to be captured.
Survivorship curves • Tracks the number of individuals alive in a group (cohort) at each age. • Type I = low death rates in early and middle life • Type II = constant death rate over life span • Type III = high death rates in early life
Population growth • Exponential growth • Characterized by rapid growth in a very short period of time. • Shows growth under ideal conditions (unlimited food, shelter, etc.)
Question… • What are some factors what would limit the growth of a population? • Some factors include availability of food, shelter, competition for resources
Population growth • Logistic growth • A more realistic model of population growth • A population will increase until it reaches carrying capacity • Carrying capacity (K) = maximum number of individuals in a population an environment can support
Question… • Can the carrying capacity change or is it a fixed number? • Carrying capacity is NOT a fixed value– it can depending on the conditions present (ex. Availability of food)
Density Dependent Factors • Density Dependent Factor • Affects population to varying degrees depending on population density • When population density increases chance of individual survival decreases • Ex. Predation, disease
Density Independent Factors • Density independent factors • Will result in more deaths or fewer births in a population regardless of population density • Ex. Weather (hurricanes, extreme cold, etc.) • Most population growth is limited by both types of factors (not just one) • Both types of factors can limit population growth
r strategists Reproduce very quickly Have lots of offspring but a short life expectancy Little or no parental care Very small at birth Ex. mice, rabbits, weeds K strategists Prolonged development Have few young with longer lifespan Extensive parental care Larger at birth Ex. Elephants, tortoises, humans Reproductive Strategies
Question… • What connections do you see between certain reproductive strategies and survivorship curves? • Type I (ex. Humans) have extensive parental care most live to full life expectancy (K strategy) • Type III (ex. Bacteria) have large numbers of offspring with little parental care high death rates in youngest individuals (r strategy)
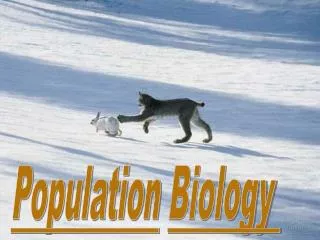
Population Fluctuations • Population sizes fluctuate as a result of interactions with other populations • Predator/Prey Interactions • The predator “lags” the prey = changes in the predator population occur shortly after similar changes in prey population
More population calculations A population of 1,492 Baltimore Orioles is introduced to an area of Blackberry farm. Over the next year, the Orioles show a death rate of 0.395 while the population drops to 1,134. What is the birth rate for this population?
More population calculations • Number of deaths = death rate x starting population 0.395 x 1492 = 589.34 deaths • Change in population = births – deaths births = change in population + deaths (1134-1492)+589.34= -358 + 589.34 = 231.34 orioles born • Birth rate = 231.34/1492 = 0.155 (15.5%)