Download
1 / 21
210 likes | 212 Views
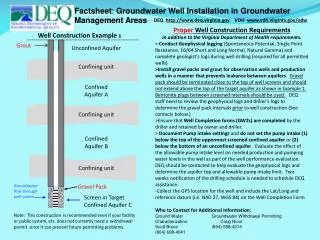
Groundwater in the East King County Groundwater Management Area (EKC GWMA). Groundwater in the East King County Groundwater Management Area (EKC GWMA). Presented by Sevin Bilir WLRD, Groundwater Protection Program. CONTRIBUTORS. Wendy Gable Collins Jim Simmonds Dan T. Smith.

E N D
Groundwater in the East King County Groundwater Management Area (EKC GWMA) Groundwater in the East King County Groundwater Management Area (EKC GWMA) Presented by Sevin Bilir WLRD, Groundwater Protection Program CONTRIBUTORS Wendy Gable Collins Jim Simmonds Dan T. Smith Eric Ferguson Sara Ogier Ken Johnson Tom Ventur Funded by KC EKC Rural Drainage Program
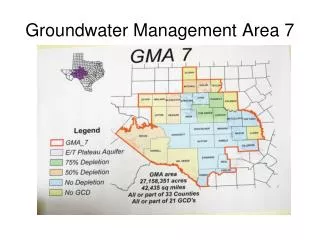
East King County Groundwater Management Area (EKC GWMA) • Rural setting • Municipalities • Topography
Scope and Summary Water resources evaluation planned for the EKC GWMA during 2005-2007. Conduct a groundwater level survey of a subset of wells previously used by the United States Geological Survey (USGS) in a study of the region in 1990 (Turney, 1995). • unincorporated areas of the EKC GWMA. • screened in the uppermost hydrologic units • water level elevations only Water levels were measured in 45 wells in early November 2005. Water levels in most groundwater wells were either about the same or on average up to five feet lower than in 1990. The differences in water levels are possibly due to lower precipitation in recent years.
Activities Based on a review of critical areas, shallow hydrologic units, decisions from the former EKC GWMA committee, and management plan, wells chosen for the study were screened in the uppermost aquifers; • Alluvium (Qal) • Vashon Recessional Outwash (Qvr) • Vashon Advance Outwash (Qva) TASKS • Choose well locations for survey • Identify well owners and obtain permission • Prepare materials & coordinate field logistics • Field reconnaissance • Conduct water level survey • Update EQuIS database • Prepare water level contour maps • Prepare technical memo • Send results to participants • Post report on KC web page
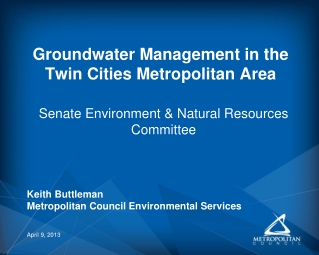
Geologic Setting Alluvium Vashon recessional outwash Vashon advance outwash Qal Qvr Duvall Qva c’ c Carnation Preston Snoqualmie/ North Bend
Well Access TASKS • Choose well locations for survey • Identify well owners and obtain permission • Prepare materials & coordinate field logistics • Field reconnaissance • Conduct water level survey • Update EQuIS database • Prepare water level contour maps • Prepare technical memo • Send results to participants • Post report on KC web page
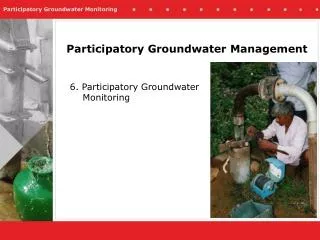
Public Feedback Reasons for lack of participation • Rumors about plans to reduce private landowner rights to water • Misinformation about a planned groundwater fee on private well use • Security • KC may use data to support an agenda that does not benefit EKC residents • Lack of response by KC • Misunderstanding of hydrogeologic processes • Misunderstanding of pumping affects on drinking water quality Common concerns • Water quantity reductions in streams, lakes, and near water supply wells • Contamination from nearby landfills, sewage waste, and iron concentrations
Well Locations Wells screened in: Qal Qvr Qva Qal/Qvr
Field Work • Field reconnaissance • GPS measurements • Field Activities Plan • Water level measurements TASKS • Choose well locations for survey • Identify well owners and obtain permission • Prepare materials & coordinate field logistics • Field reconnaissance • Conduct water level survey • Update EQuIS database • Prepare water level contour maps • Prepare technical memo • Send results to participants • Post report on KC web page
Post- Fieldwork Data Processing Data Check / Analysis Compared to previous results Mapping Many sites located with GPS/Trimble equipment EQuiS Database Water level data entered into the EQuIS database tables Corrections Updates made to addresses and owner names Reporting Results letter report to owners Internal report Letter report to web site TASKS • Choose well locations for survey • Identify well owners and obtain permission • Prepare materials & coordinate field logistics • Field reconnaissance • Conduct water level survey • Update EQuIS database • Prepare water level contour maps • Prepare technical memo • Send results to participants • Post report on KC web page
Water Level Elevation Differences; 1990 to 2005 Alluvium (Qal) & Vashon Recessional Outwash (Qvr) Aquifer
Hydrogeologic Results Alluvium (Qal) & Vashon Recessional Outwash (Qvr) Aquifer Decreases in water level Water levels decreased in 16 of the 25 wells. 4 of those wells showed significant decreases: • Two wells near the SE boundary; 9.9 and 6.38 ft lower levels. • Griffin Creek well, near Carnation; 7.79 ft drop in water level. • Hilltop well near Carnation; 15.95 ft drop in water level. Increases in water level Water levels increased in 8 of the 25 wells. 2 of those wells showed significant increases: 16- 10 ft lower 10 - 5 ft lower 5 - 1 ft lower 1 ft lower - 1 ft higher 1 - 5 ft higher 5 -10 ft higher 10 – 15 ft higher Not measured in 1990 • Grounding well in the Wilderness Rim Development; 7.03 ft higher water level. • Residential well near Chester Morse Lake; 11.59 ft higher water level.
Geohydrologic Map; 1990 & 2005 Alluvium (Qal) & Vashon Recessional Outwash (Qvr ) Aquifer
Water Level Elevation Differences; 1990 to 2005 Vashon Advance Outwash (Qva) Aquifer
Hydrogeologic Results; 1990 to 2005 Vashon Advance Outwash (Qva) Aquifer Decreases in water level Water levels decreased in 17of the 20 wells. • Recovering well between Carnation and Duvall; 8.9 ft lower water level. • Snoqualmie park adjacent to I-90; 3.2 ft lower water level. Increases in water level Water levels increased in 3 of the 20 wells. Only 1 of those wells showed significant increase. • A well in the Woodinville area had a 5.14 ft higher water level. 10 to 5 ft lower 5 to 1 ft lower 1 ft lower to 1 ft higher 1 to 5 ft higher 5 to 10 ft higher Not measured in 1990
Geohydrologic Map; 1990 & 2005 Vashon Advance Outwash Aquifer (Qva)
Reasons for Observed Differences • During the three year time period prior to 1990, annual precipitation increased. Annual precipitation has been decreasing since 1996. Precipitation (inches) Date • Measurements in 2005 were all taken within a 3 day period. The USGS measurements were taken between May and December 1990. • Increased development in the EKC GWMA.
Summary • Water levels measured in 45 wells in early November 2005. • Water levels were either about the same or on average up to five feet lower than in 1990. • The differences in water levels between 1990 and 2005 are possibly due to lower precipitation in recent years. • Increased activity in the past 15 years. Landowners reported adding wells, replacing wells, moving to water districts, or deepening wells.
Comments • Benchmark of the present day health of the aquifer • Water resources evaluation • Improve education of the public regarding KC policies and groundwater concepts • Build a more trusting relationship between the KC council and the EKC public