Download
1 / 6
60 likes | 65 Views
EVM Quick-Look Report. Top Issues Summary. Cumulative to Date Dollars. Bulls-Eye. • The Bulls-Eye Chart provides overall status at a glance. The point labeled '0' represents the status for the current month. The point labeled '1' represents the status one month ago.

E N D
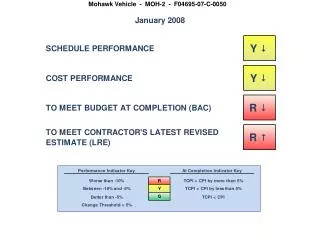
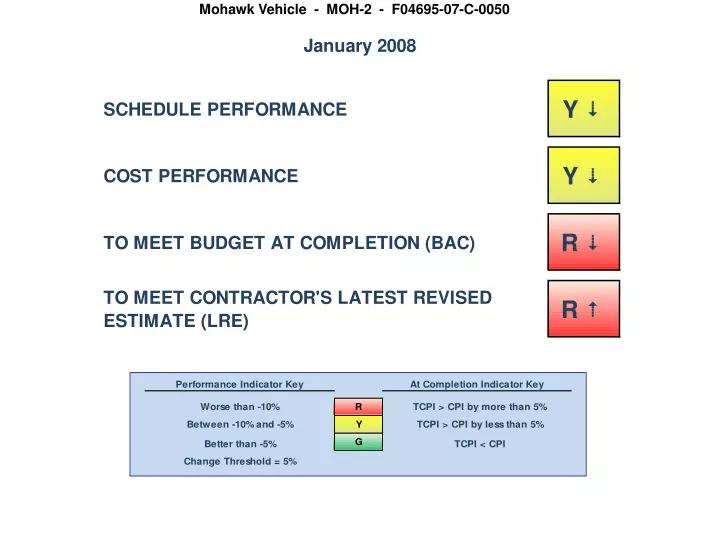
Top Issues Summary Cumulative to Date Dollars
Bulls-Eye • The Bulls-Eye Chart provides overall status at a glance. The point labeled '0' represents the status for the current month. The point labeled '1' represents the status one month ago. • The project is currently behind schedule. • The project is currently over cost. • Normally, a negative schedule variance will have a negative impact on cost by program completion. Special attention should be paid to cost for behind-schedule elements as the contract approaches completion. Cost/Schedule Variance • The Cost/Schedule Variance Chart graphically depicts the cost and schedule variances in percentages, and provides the associated values in dollars (in thousands). • Currently, the contractor has an unfavorable schedule variance of -427.8 (-5.9%) and an unfavorable cost variance of -499.0 (-7.3%) • The Budget at Completion (BAC) is 20,796 and the effort is 33% complete. • The contractor's Latest Revised Estimate (LRE), which depicts their Estimate at Completion (EAC), is 20,761, which is 35 less than the BAC.
Estimate at Completion Validity • The LRE Validity Chart compares the contractor's Latest Revised Estimate (LRE) to several statistically derived values for the Estimate at Completion (EAC). The LRE and EAC are terms that are often used interchangeably, representing the estimate of the total direct charges against the contract. The LRE should be somewhere within the range of the calculated values. • Currently, MOH-2 - Mohawk Vehicle LRE of 20,761 is 35 less than the BAC • The LRE appears to be below the range of the statistically derived values. • Since the LRE falls outside the range of calculated values, the contractor should re-evaluate the LRE as soon as possible. To Complete Performance Index (TCPI) • The To Complete Performance Index (TCPI) chart illustrates the efficiency rate that the contractor must accomplish to meet the BAC or LRE, based on the contractor's performance to date. • To date, the cost performance efficiency has been 0.932. In other words, for each dollar spent, the contractor has accomplished $0.93 worth of the work budgeted. • To meet the BAC, the contractor must accomplish $1.04 of work for each dollar spent. • Given the performance to date, it does not seem likely that the contractor will be able to meet the BAC. • To meet the LRE, the contractor must accomplish $1.04 of work for each dollar spent. • Given the performance to date, it does not seem likely that the contractor will be able to meet the LRE.