Download
1 / 38
380 likes | 387 Views
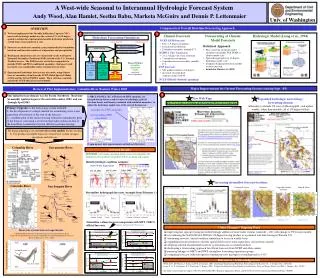
This study examines the hydrologic impacts of climate change in the Western US, specifically the Pacific Northwest and Columbia River Basin. It discusses changes in temperature, precipitation, snowpack, runoff timing, and flood risk. The study also explores the effects of climate change on water resources, ecosystems, and coldwater fish habitats.

E N D
Hydrologic Implications of Climate Change for the Western U.S., Pacific Northwest, and Columbia River Basin • Alan F. Hamlet, • Philip W. Mote, • Dennis P. Lettenmaier • JISAO/CSES Climate Impacts Group • Dept. of Civil and Environmental Engineering • University of Washington
Recession of the Muir Glacier Aug, 13, 1941 Aug, 31, 2004 Image Credit: National Snow and Ice Data Center, W. O. Field, B. F. Molnia http://nsidc.org/data/glacier_photo/special_high_res.html
Cool Season Climate of the Western U.S. PNW GB CA CRB DJF Temp (°C) NDJFM Precip (mm)
Global Climate Change Scenarios and Hydrologic Impacts for the PNW
Consensus Forecasts of Temperature and Precipitation Changes from IPCC AR4 GCMs
+3.2°C °C +1.7°C +0.7°C 1.2-5.5°C 0.9-2.4°C Observed 20th century variability 0.4-1.0°C Pacific Northwest
% -1 to +3% +6% +2% +1% Observed 20th century variability -2 to +21% -1 to +9% Pacific Northwest
Will Global Warming be “Warm and Wet” or “Warm and Dry”? Answer: Probably BOTH! Natural Flow Columbia River at The Dalles
Regionally Averaged Cool Season Precipitation Anomalies PRECIP
Schematic of VIC Hydrologic Model and Energy Balance Snow Model Snow Model
The warmer locations are most sensitive to warming 2060s +2.3C, +6.8% winter precip
Changes in Simulated April 1 Snowpack for the Canadian and U.S. portions of the Columbia River basin (% change relative to current climate) 20th Century Climate “2040s” (+1.7 C) “2060s” (+ 2.25 C) -3.6% -11.5% -21.4% -34.8% April 1 SWE (mm)
Trends in April 1 SWE 1950-1997 Mote P.W.,Hamlet A.F., Clark M.P., Lettenmaier D.P., 2005, Declining mountain snowpack in western North America, BAMS, 86 (1): 39-49
Overall Trends in April 1 SWE from 1947-2003 DJF avg T (C) Trend %/yr Trend %/yr
Temperature Related Trends in April 1 SWE from 1947-2003 DJF avg T (C) Trend %/yr Trend %/yr
Precipitation Related Trends in April 1 SWE from 1947-2003 DJF avg T (C) Trend %/yr Trend %/yr
Simulated Changes in Natural Runoff Timing in the Naches River Basin Associated with 2 C Warming • Impacts: • Increased winter flow • Earlier and reduced peak flows • Reduced summer flow volume • Reduced late summer low flow
Seasonal Water Balance Naches Basin 20th Century Climate 20th Century Climate + 2.0 C
Seasonal Changes in Water Balance for the Naches Basin (+2.0 C Simulation – 20th Century Simulation)
Nooksack River
Mapping of Sensitive Areas in the PNW by Fraction of Precipitation Stored as Peak Snowpack HUC 4 Scale Watersheds in the PNW
Climate Change Impacts are Similar to Impacts of Water Management in PNW Hydropower Systems Estimated natural flows Skagit River at Mt. Vernon
Regionally Averaged Temperature Trends Over the Western U.S. 1916-2003 Tmax PNW GB CA CRB Tmin
Simulated Changes in the 20-year Flood Associated with 20th Century Warming DJF Avg Temp (C) X20 2003 / X20 1915 DJF Avg Temp (C) X20 2003 / X20 1915 X20 2003 / X20 1915
20-year Flood for “1973-2003” Compared to “1916-2003” for a Constant Late 20th Century Temperature Regime DJF Avg Temp (C) X20 ’73-’03 / X20 ’16-’03 X20 ’73-’03 / X20 ’16-’03
Summary of Flooding Impacts Rain Dominant Basins: Possible increases in flooding due to increased precipitation variability, but no significant change from warming alone. Mixed Rain and Snow Basins Along the Coast: Strong increases due to warming and increased precipitation variability (both effects increase flood risk) Inland Snowmelt Dominant Basins: Relatively small overall changes because effects of warming (decreased risks) and increased precipitation variability (increased risks) are in the opposite directions.
Landscape Scale Ecosystem Impacts
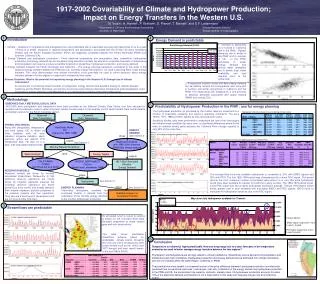
9.0 2005 8.0 7.0 2004 6.0 5.0 Annual area (ha × 106) affected by MPB in BC 2003 4.0 3.0 2.0 2002 1.0 2001 2000 1999 0 1910 1930 1950 1970 1990 2010 Year Bark Beetle Outbreak in British Columbia (Figure courtesy Allen Carroll)
Temperature thresholds for coldwater fish in freshwater • Warming temperatures will increasingly stress coldwater fish in the warmest parts of our region • A monthly average temperature of 68ºF (20ºC) has been used as an upper limit for resident cold water fish habitat, and is known to stress Pacific salmon during periods of freshwater migration, spawning, and rearing +2.3 °C +1.7 °C
Wide-Spread Glacial Retreat has Accompanied 20th Century Warming. Loss of glacial mass may increase summer flow in the short term and decrease summer flow in the long term. 1902 2002 The recession of the Illecillewaet Glacier at Rogers Pass between 1902 and 2002. Photographs courtesy of the Whyte Museum of the Canadian Rockies & Dr. Henry Vaux.
Impact Pathways Associated with Climate • Changes in water quantity and timing • Reductions in summer flow and water supply • Increases in drought frequency and severity • Changes in hydrologic extremes • Changing flood risk (up or down) • Summer low flows (glacial losses) • Changes in groundwater supplies • Changes in water quality • Increasing water temperature (flow timing/loss of glaciers) • Changes in sediment loading (up or down) • Changes in nutrient loadings (up or down) • Changes in land cover via disturbance • Forest fire • Insects • Disease • Invasive species
Impact Pathways Associated with Climate • Changes in the energy sector • Hydropower • Energy demand • Changes in outdoor recreation • Tourism • Skiing • Camping • Boating • Changes in environmental impacts and services • Fish and wildlife management • Streamflow augmentation and temperature control • Hatchery design and management • Habitat restoration programs • Endangered species recovery programs • Invasive species (e.g. warm water fish)
Impact Pathways Associated with Climate • Changes in transportation corridors • Changing risk of flooding, avalanche or debris flows • Sea level rise • Coastal engineering • Land use planning • Changes in engineering design standards • Road construction and maintenance • Storm water systems • Flood plain definitions • Building design • Land slide risks
Approaches to Adaptation and Planning • Anticipate changes. Accept that the future climate will be substantially different than the past. • Use scenario based planning to evaluate options rather than the historic record. • Expect surprises and plan for flexibility and robustness in the face of uncertain changes rather than counting on one approach. • Plan for the long haul. Where possible, make adaptive responses and agreements “self tending” to avoid repetitive costs of intervention as impacts increase over time.