Download
1 / 43
430 likes | 511 Views
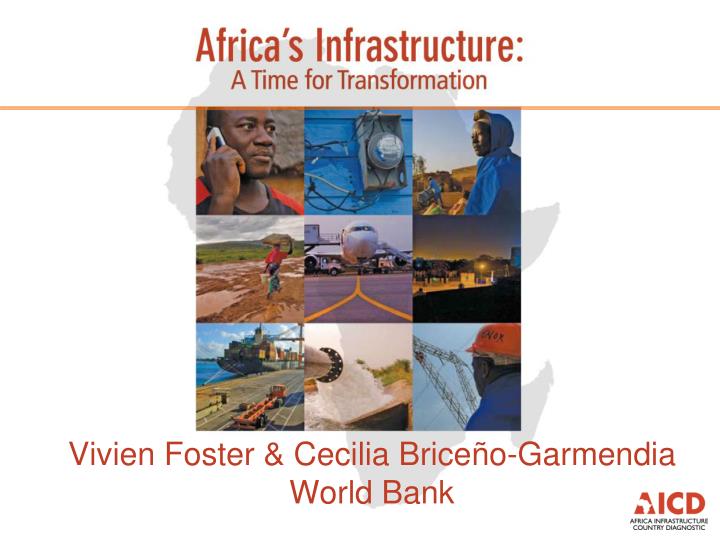
Vivien Foster & Cecilia Brice ñ o-Garmendia World Bank. Africa Infrastructure Country Diagnostic: a multi-stakeholder effort. Key Message #1. Water spending needs are US$32 billion a year, (of which US$22 billion for WSS MDGs).

E N D
Vivien Foster & Cecilia Briceño-Garmendia World Bank
Africa Infrastructure Country Diagnostic: a multi-stakeholder effort
Key Message #1 Water spending needs are US$32 billion a year, (of which US$22 billion for WSS MDGs)
An illustrative water investment agenda for the next decade • Water supply – meet MDG target by 2015 (and rehabilitate existing systems to ensure sustainability) • Sanitation – meet MDG target by 2015 (and rehabilitate existing systems to ensure sustainability) • Irrigation – develop all viable large and small scale irrigation opportunities amounting to 7 million has. • Water resources – develop all water storage associated with feasible hydro-projects (of at least 35 GW)
Overall price tag of US$32 billion annually – mainly MDG related * Assuming medium level of service
How investment needs here are different from previous estimated? • Analysis expands existing methodologies: • Includes non-standardized infrastructure costs, reflecting country-specific patterns of demography and geography and differences in levels of technological innovation and local market development • Assumes that the relative prevalence of water and sanitation supply modalities will remain constant from 2006 to 2015 • Estimates rehabilitation needs based on the specific status of assets and rehabilitation backlog of each country • Allows running sensitivity analysis on different parameters (quality of service, costs, timeframe) and exploring affordability issues
18 countries (many fragile) would need to spend more than 5 percent of GDP to achieve MDG in WSS Assuming medium level of service
Key Message #2 First step towards achieving water security is to develop priority hydro-power schemes
Achieving full water security is an unquantified challenge • Africa’s hydrological legacy is particularly challenging • High rainfall variability within and across years • 60 international rivers • Extreme hydrological events (droughts/floods) have major macro-economic impacts • Ethiopia, Kenya, Mozambique all losing 1% GDP annually • Africa’s per capita water storage capacity is 200m3 versus at least 1,000m3 in other developing regions • Cost of increasing storage by these multiples would be prohibitive in economic terms • Raising Ethiopia’s storage to RSA levels would cost US$35bn,
Major development of hydro-power over next decade particularly with regional trade * Simple average
Key Message #3 Potential to viably double existing irrigated area but crucially sensitive to costs
About 7 million hectares of new irrigation potential – predominantly small scale Irrigation is mostly viable only for cash or high value food crops (horticulture) with revenues >US$2,000/ha/yr
Small scale gives much higher returns, but potential area much more sensitive to cost
Spatial extension of large and small scale irrigation potential identified
Irrigation potential concentrated in some 15 countries, most notably Nigeria Note: Graphs show all countries with more than 50,000 hectares of potential for large or small scale irrigation
Key Message #4 Access stagnant and inequitable, main action at lower end of ladder
Access trends stagnant at best, fastest growth takes place on lower rungs of ladder
Second best solutions as inequitably distributed as first best solutions
Prevalence of unimproved latrine Prevalence of improved latrine Prevalence of open defecation Bimodal pattern Septic tank Septic tank Septic tank Improved Improved Septic tank Improved Unimproved Unimproved Unimproved latrine latrine Open Open latrine Open Improved latrine latrine latrine Unimproved latrine latrine defecation defecation defecation Open defecation Sanitation presents a number of different typologies that drive policy choice
Key Message #5 Existing spending on MDG targets at US$7.6 billion a year more than previously thought
16 countries are already spending more than 2 percent of GDP
LICs heavily dependent on donor capital, households play key role in sanitation
Key Message #6 There is a ‘funding gap’ of US$11.4 billion a year for WSS, even after the US$2.9 billion ‘efficiency gap’ is recouped
What do we mean by an efficiency gap? • Water tariffs recover less than 2/3 of the full capital cost of the service (60%) • Operating inefficiency of utilities creates a drag • Non-revenue water of 34% versus best practice 10% • Revenue collection of 72% versus best practice 100% • Low number of connections per employees (259 connections/employee on average) • Low public sector budget execution ratios lead to unspent resources (US$0.2 bn)
There is a funding gap of $11.4 billion a year – even after recouping inefficiencies
A number of countries have an efficiency gap in excess of 0.5 percent of GDP
A number of countries have a funding gap in excess of 2 percent of GDP
Key Message #7 Cost recovery could be improved without major detrimental poverty impacts
On average water tariffs cover less than two thirds of full capital costs of US$1.00/m3
Piped water subsidies are highly regressive in their distributional incidence PROGRESSIVE
Cost recovery tariffs would be affordable to MICs and LIC populations with access
Cost recovery tariffs would be affordable to MICs and LIC populations with access LOWER BOUND LOWER BOUND – subsistence consumption defined as six cubic meters at $1 each or 10 cubic meters at $0.60 each
Cost recovery tariffs would be affordable to MICs and LIC populations with access LOWER BOUND
Cost recovery tariffs would be affordable to MICs and LIC populations with access LOWER BOUND UPPER BOUND UPPER BOUND – subsistence consumption defined as ten cubic meters at $1 each (full capital cost recovery)
Cost recovery tariffs would be affordable to MICs and LIC populations with access LOWER BOUND UPPER BOUND
Key Message #8 Improving efficiency has a tangible impact in sector performance
Detrimental impact of utility inefficiency on service expansion and quality
Mixed evidence on impact of institutional reforms on improving efficiency
Key Message #9 Considerable cost savings could be made by adopting alternative technologies
Adopting lower standards can reduce costs of meeting MDG by 6 percent of GDP for fragile states
Key Message #10 Some countries may simply need more time to reach MDG targets
Time needed to meet MDG targets with today’s budget envelopes