Download
1 / 42
420 likes | 627 Views
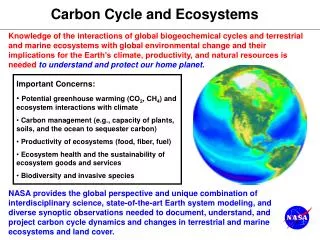
Land carbon cycle managed ecosystems and climate. Galina Churkina Institute for Advanced Sustainability Studies Potsdam, Germany. Outline. Introduction: Role of land ecosystems in the global carbon cycle Drivers behind the European carbon sink Challenges in modeling of land ecosystems.

E N D
Land carbon cycle managed ecosystemsand climate Galina Churkina Institute for Advanced Sustainability Studies Potsdam, Germany
Outline • Introduction: Role of land ecosystems in the global carbon cycle • Drivers behind the European carbon sink • Challenges in modeling of land ecosystems
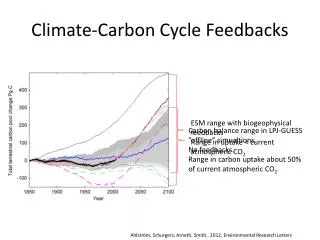
Global anthropogenic emissions (CAntr) Absorbed by land and ocean Remained in atmosphere (CAtm)
Airborne Fraction (AF)= CAtm/CAntr~ 0.4 in 1950-2000 Trend in AFafter 2000 -? 2005: Jones and Cox, JRL
Yes (Le Quere et al. Nature Geo, 2009) Earth’s carbon sinks are in decline No (Knorr, GRL, 2009, Francey et al. ICDC8, 2009) Earth’s carbon sinks are increasing proportionally to emissions Is AF increasing?
CAtm = CAntr - CLand- COcean (Model) (Model) (Statistics) Crucial role in C uptake Underestimated ? 2009: Le Quere et al.,Nature Geo
Atmospheric CO2 Concentrations Modeled with CLIMBER-BGC Observed (atmosphere) Observed (atmosphere) Observed (atmosphere) Management -? (ice core) (ice core) (ice core) 2009: Churkina et al. GBC
Drivers behind the European carbon sinkChurkina et al. 2010, Biogeosciences
European ecosystems are a carbon sink of ~ 111±280 teragrams (Janssens et al. 2003) ~ 232±50 teragrams (Schulze et al. 2009)
Why Europe is a carbon sink? Atmospheric deposition of nitrogen Regrowing forests/ abandment of croplands
0.1Tg/yr 0.03Tg/yr Atmospheric deposition of nitrogen on land ecosystems of Europe 2007: Dentener et al., GBC
Land cover conversion: Historical trends -6900sq km /yr 5800 sq km/yr -7000 sq km/yr 10100 sq km/yr 1100 sq km/yr -3200 sq km/yr 2008: After Ramankutty et al., GBC
0.02 degC/yr 0.01 degC/yr Surface Temperature of Europe 2009: Chen et al., MPI-BGC Tech. Rep.
1.11 ppm/yr 0.29 ppm/yr Atmospheric CO2 After Etheridge et al, 1996 and Keeling & Whorf, 2005
Rates of change in environmental drivers accelerated in the second half of the 20th century
Land C balance and its drivers Atmospheric CO2 andN deposition Climate C balance of Europe Land Use (Conversion & Management)
Land Use Change (Management) Land cover # 1* (Change) Land cover # 1 Land cover # 2 (Conversion) Although modification is not always detectable, it may have strong effect on carbon balance (forest management, fertilization, etc)
Land C balance and its drivers Atmospheric CO2 andN deposition Climate ? ? C balance of Europe ? Land Use (Conversion)
Land use change JULES ORCHIDEE N cycle BIOME-BGC OCN Vegetation models include:C, H2O cycles and More details in: 2010: Churkina et al., Biogeosciences
Data compilation (2009: Schulze et al.) One century of the European carbon balance Atmospheric models: mean and uncertainty (2009:Schulze et al.)
Is response reasonable? NPP change in response to CO2 increase of 100 ppm *2005:Ainsworth & Long, New Phyt.
Is response reasonable? Obs. NPP change in response to N increase by 1-1000 kgN/ha/yr Modeled NPP change in response to N increase by 2-28 kgN/ha/yr * 2007:Elser et al. Ecol. Letters 2008: LeBauer & Treseder, Ecology
Conclusions • European ecosystems are a C sink because of interactions between • CO2 fertilization effect • Climate • N deposition • land cover conversion • C sink is likely underestimated because models do not simulate interactions of LUC and abiotic changes
Extent of land use change Luyssaert et al., in preparation
Modeling of croplands ton per ha Gap between modeled and statistical yields of wheat. Averages for 1997-2003 Ma et al. sumbitted
Carbon Cycle of Berlin 1 Data sources 1 Federal Working Committee on Energy-Balances 2 Berlin Senat 3 Statistics Agency Berlin-Brandenburg 4 Tree inventories of Berlin‘s districts 2 2 3 3 1 1 2 2 4 Direct C release Indirect C release C storage C uptake Gottschalk et al., in preparation