Download
1 / 29
290 likes | 458 Views
Vermont’s Ecology and Environment. An introduction to town planning for natural resources. Agency of Natural Resources. Vermont is 75% Forested. Some estimates are 20%. Wildlife History. 1750. 1800. 1850. 1900. 1950. 2000. Caribou Elk Wolverine Bison Mountain Lion Wolf Marten

E N D
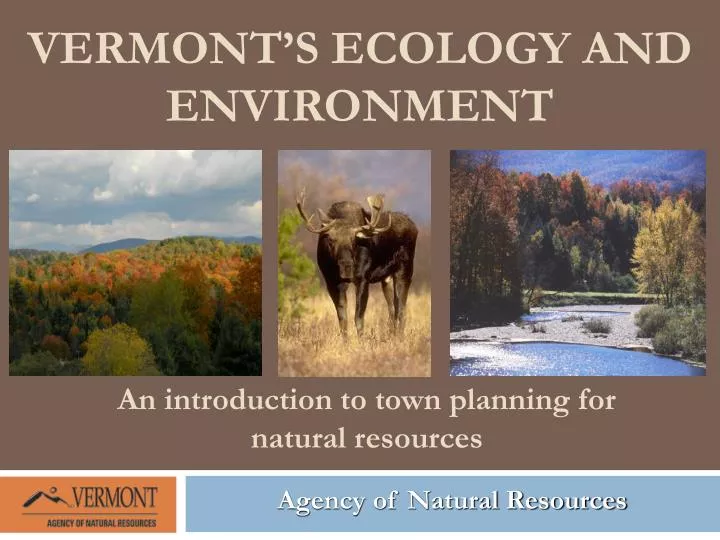
Vermont’s Ecology and Environment An introduction to town planning for natural resources Agency of Natural Resources
Vermont is 75% Forested Some estimates are 20%
Wildlife History 1750 1800 1850 1900 1950 2000 Caribou Elk Wolverine Bison Mountain Lion Wolf Marten Lynx White-tailed Deer Beaver Fisher Moose Turkey Coyote Virginia Opossum Black Bear (Bountied in 1779) (Bountied in 1779) (concern of too many) (Population numbers drop precipitously)
Forest Cover Across the State Forest (71%) Non-Forest (21%) Water (8%)
Vermont designated one of “America’s most endangered places.” Rate of development is 2.5 times rate of population growth. 1997 - 2007, 75 square miles were developed in VT (7X the area of Burlington). Vermonters for a Sustainable Population Losing Habitat
Fewer jobs tied to the land Land based economy has shifted to tourism and recreation Land-based Culture?
Compact town design in Bellows Falls Changing Growth Patterns St. Albans Vermont, 2002 “Photo from Above and Beyond.“ Campoli, J., Humstone, E., & MacLean, A. 2002.
Sprawl Development Patterns dispersed, auto-dependent development outside of compact urban and village centers, along highways, and in rural countryside. (SmartGrowth Vermont) “Photos from Above and Beyond." Campoli, J., Humstone, E., & MacLean, A. 2002.
Pattern Matters Forest Fragmentation More intense fragmented forest in a rural community Less fragmented forest in a rural community
Parcelization 1960s 1970s 1950s 1980s 1990s "Above and Beyond: " 2002. Campoli, J., Humstone, E., & MacLean, A. Planners Press. Chicago, Illinois.
81% of Land in Vermont is Privately Owned Privately Held Land in Vermont Private Public
Auto Dependent Employment • 625,741 people in VT • 67.9% or 424,899 Vermonters are in the workforce • Of the working Vermonters 75% or 318,600 drive alone • Most drive 10 – 25 miles each way
Population and Housing Trends By 2030, Vermont’s population is expected to increase by 14% with and additional 86,000 residents. Development Outpaces Population Since 2000, there have been approximately 1,400 new households annually. U.S. Census, 2010. Vermont Housing Finance Agency, 2009. Transition Vermont, 2009
Outdoor recreation supports 35,000 jobs $4.1 million from hunting, fishing and wildlife watching $187 million annually in state tax revenue $2.5 billion annually in retail sales and services Economic Contributions
Biological Diversity in Vermont • There are between 24,000 – 43,000 species in Vermont. • Most species we know little about Vermont Biodiversity Project
Loss of Wetlands Fragmentation hurts ecological function
Invasive Species on the Rise • 2/3 of VT’s trees are at risk to 3 invasive tree pests • Non-native plants are outcompeting native ones, reducing biodiversity • Water quality and recreation are impacted by aquatic invasives
Pollution Phosphorus Concentrations in Lake Champlain affects water quality, recreation, transportation and aesthetics
Changes in Precipitation Map: Progress Report of the Interagency Climate Change Adaptation Task Force: Recommended Actions in Support of a National Climate Change Adaptation Strategy, October 5, 2010.
Climate Change Forecasts • Current: Temperatures have increased 1.8°F since 1970, with winter rising faster. • Projected: Average temperatures are projected to rise 9°F to 13° F in winter by late-century. • Current: Precipitation has increased 15-20% over the past 50 years with 67% of this falling in heavy precipitation events. • Projected: Winter precipitation will increase on the order of 20-30% with less snow - more rain. • Projected: Short-term summer droughts are projected to occur 2x as often From Union of Concerned Scientists – Confronting Climate Change in the Northeast (NECIA 2007)
Changing Climate Trends • More frequent hot (over 90), humid days • Longer growing seasons • Worsening of air quality in areas where problems already exist • Increased heavy downpours • More frequent winter thaws and earlier springs • Less winter precipitation falling as snow and more as rain • Earlier spring snowmelt resulting in earlier peak river flows • More frequent short-term droughts in late summer and fall
Ecosystem resiliency A Resilient Landscape has space for dynamic natural processes Connect areas of physical landscape diversity for climate change adaptation
Habitat Blocks Areas of natural cover surrounded by roads, development and agriculture • Interior forest habitat and intact ecological processes
Raccoon Hare Coyote Small rodent Porcupine Bobcat Cottontail Beaver Black bear Squirrel Weasel Mink Fisher Woodchuck Deer Muskrat Moose Red fox Songbirds Sharp-shinned hawk Bald eagle Skunk Cooper’s hawk Harrier Broad-winged hawk Goshawk Kestrel Red-tailed hawk Horned owl Raven Barred owl Osprey Turkey vulture Turkey Reptiles Garter snake Ring-neck snake Amphibians Wood frog Wildlifepresent in Forest Patches Tier 3 100-500 acre blocks Tier 2 500-2500 acre blocks Tier 4 20-100 acre blocks Tier 5 1-20 acre blocks Tier 1 Undeveloped Raccoon Hare Small rodent Porcupine Cottontail Beaver Squirrel Weasel Mink Woodchuck Deer Muskrat Moose Red fox Songbirds Sharp-shinned hawk Bald eagle Skunk Cooper’s hawk Harrier Broad-winged hawk Goshawk Kestrel Red-tailed hawk Horned owl Raven Barred owl Osprey Turkey vulture Turkey Reptiles Garter snake Ring-neck snake Amphibians Wood frog Raccoon Hare Small rodent Porcupine Cottontail Beaver Squirrel Weasel Mink Woodchuck Deer Muskrat Red fox Songbirds Sharp-shinned hawk Skunk Cooper’s hawk Harrier Broad-winged hawk Kestrel Horned owl Barred owl Osprey Turkey vulture Turkey Reptiles Garter snake Ring-neck snake Most Amphibians Wood frog Raccoon Small rodent Cottontail Squirrel Muskrat Red fox Songbirds Skunk Most Reptiles Most Amphibians Raccoon Hare Small rodent Porcupine Cottontail Beaver Squirrel Weasel Woodchuck Muskrat Red fox Songbirds Skunk Most Reptiles Garter snake Ring-neck snake Most Amphibians From Above and Beyond." Campoli, J., Humstone, E., & MacLean, A. 2002.
Area Dependent Mammal Species Bobcat 5,760 ac (SGCN) Black Bear 19,200 ac (SGCN) Moose 1,280 - 12,800 ac River Otter 15-30 linear miles (SGCN) Fisher 4,747 - 9,600 ac (DeGraaf & Rudis 1986)
Conserved Land by Elevation • Does conservation in your town adequately address? • Elevation zones • Bedrock & Surficial geology zones • Diversity in the physical landscape Vermont Biodiversity Project