Download
1 / 4
40 likes | 177 Views
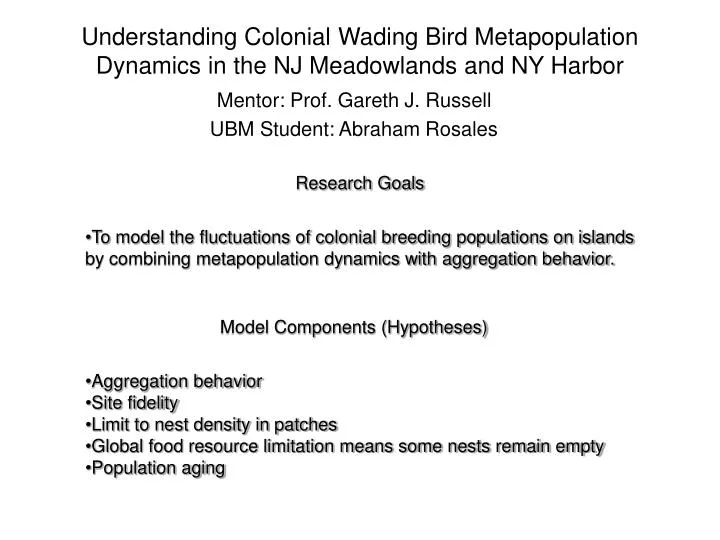
Understanding Colonial Wading Bird Metapopulation Dynamics in the NJ Meadowlands and NY Harbor. Research Goals To model the fluctuations of colonial breeding populations on islands by combining metapopulation dynamics with aggregation behavior. Mentor: Prof. Gareth J. Russell

E N D
Understanding Colonial Wading Bird Metapopulation Dynamics in the NJ Meadowlands and NY Harbor • Research Goals • To model the fluctuations of colonial breeding populations on islands by combining metapopulation dynamics with aggregation behavior. Mentor: Prof. Gareth J. Russell UBM Student: Abraham Rosales • Model Components (Hypotheses) • Aggregation behavior • Site fidelity • Limit to nest density in patches • Global food resource limitation means some nests remain empty • Population aging
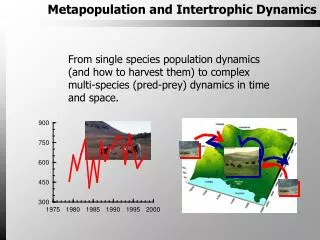
Great Egret Nesting Data Number of Nests Time (year) *Different color lines represent different breeding populations
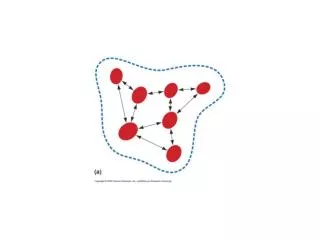
Model Outline (one nesting season) • Colony Development • Birds arrive in random order • Patch allocation by “attractiveness” function, based on • Resource Availability (Nest sites) • Desire to be with others (aggregation behavior) • Site Fidelity (where the individual was the year before) • Reproduction • Reproduction Rate • Follows the density-dependent Theta-Logistic model • λ= r(1-(N/K)Θ) • Offspring Number • Random Poisson Distribution with reproduction rate as its mean • Death and Aging • Random accidental death • Death from old age
Example outputs • These graphs have different global density dependence based on their global Θ value • Graph A has a global Θ=0.447214, strong density dependence • Graph B has a global Θ=5, low density dependence • What we are seeing in these graphs is that as global Θ value increase so does the number of fluctuating populations • We are still trying to find out the reason for this kind of behavior Graph A Number of Nests Graph B Time (year) *Different color lines represent different breeding populations