Download
1 / 35
350 likes | 436 Views
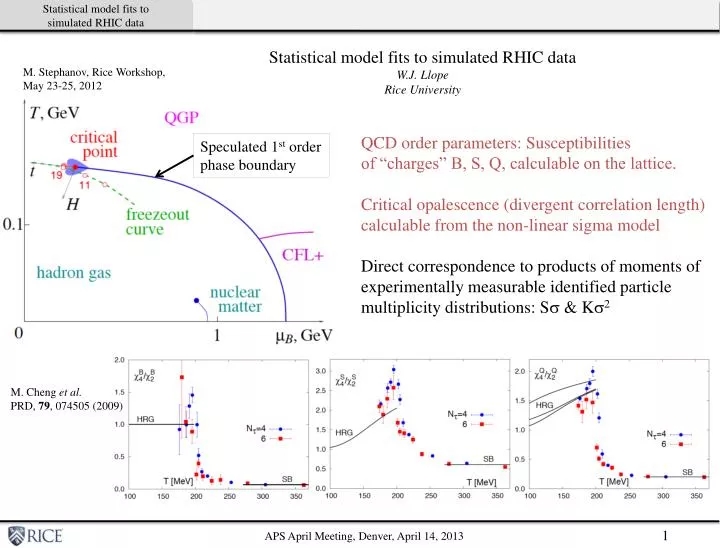
Statistical model fits to simulated RHIC data W.J. Llope Rice University. M. Stephanov, Rice Workshop, May 23-25, 2012. QCD order parameters: Susceptibilities of “charges” B, S, Q, calculable on the lattice. Critical opalescence (divergent correlation length)

E N D
Statistical model fits to simulated RHIC data W.J. Llope Rice University M. Stephanov, Rice Workshop, May 23-25, 2012 QCD order parameters: Susceptibilities of “charges” B, S, Q, calculable on the lattice. Critical opalescence (divergent correlation length) calculable from the non-linear sigma model Direct correspondence to products of moments of experimentally measurable identified particle multiplicity distributions: Ss & Ks2 Speculated 1st order phase boundary M. Cheng et al. PRD, 79, 074505 (2009)
STAR Results (QM2012) Basic approach in STAR is: take data at different beam energies, select central collisions, & then look for “non-monotonic behavior” of moments products Ss & Ks2 net-protons X. Luo for STAR, QM2012 * Cleymans et al. PRC 73, 034905 (2006) net-charge (& net-kaons) D. McDonald for STAR, QM2012 No √sNN-localized enhancement in the moments products w.r.t. Poisson and other (HRG, binomials, mixed events) baselines was observed
UrQMD simulations This approach assumes that a tight (5%) centrality cut at a given beam energy tightly constrains the events on the phase diagram… If this is not true, then the signal of critical behavior could be buried by events that are not near enough to the critical point to result in the expected enhancements to the moments products. What is the variance of μB in such samples of events? This question was studied by coupling UrQMD and Thermus. UrQMD 3.3p1, default parameters, six centrality bins save identified particle multiplicities in 1fm/c time-steps run Thermus for each time-step in each event, GCE * Cleymans et al. PRC 73, 034905 (2006) T. Tarnowsky for STAR, QM2011 M. Lisa, Workshop On Fluctuations, Correlations and RHIC LE Runs, BNL,Oct 2011
Example Fits of a single event vs. time, 19.6 GeV, 0-5% t=5fm/c t=20fm/c t=40fm/c t=60fm/c t=80fm/c t=100fm/c t=200fm/c t=500fm/c
Example Fits of a single event vs time, 200 GeV, 0-5% t=5fm/c t=20fm/c t=40fm/c t=60fm/c t=80fm/c t=100fm/c t=200fm/c t=800fm/c
The Variances… Freeze-out positions on the phase diagram for 50 events T (GeV) μB (GeV) Even in 0-5% central collisions, the variances are large…
μB distributions at freeze-out, 0-5% and 5-10% central Run UrQMD to 500-800 fm/c in each of thousands of events, plot Probability(mB) by √sNN 200 7.7 √sNN (GeV) 7.7 11.5 19.6 27 39 62.4 200 Probability 200 7.7 mB (MeV) For the mB range of interest (mB>~200MeV), the mB distributions are ~200 MeV wide! Compare to expected mB-width of critical enhancement of Δ(mB)~50-100 MeV… C. Athansiou et al., PRD 82, 074008 (2010), R. Gavai & S. Gupta, PRD 78, 114503 (2008)
Use event-by-event values of pbar/p to constrain event-by-event values of μB Use event-by-event pbar/p ratio to gate the moments analyses! pbar/p = exp(-2μB/T) Temperature is a weak function of centrality and √sNN S. Das for STAR, QM2012 Direct relationship between pbar/p and apparent μB values event-by-event! Significant overlap in μB distributions from different root-s values even in 0-5% central collisions trend also holds for less central events w/ non-zero pbar and p multiplicities 200 0-5% centrality error bars here are the RMS values! (±1σ about mean) 7.7 14 = 2/T T~140MeV
STAR ratios of average multiplicities in centrality bins from QM2012 S. Das for STAR, QM2012 STAR used Thermus and extracted (<mB>,<T>) from ratios of efficiency-corrected yields for |y|<0.1 in specific centrality bins at √sNN = 7.7, 11.5, 39, 200 GeV Indicates: <mB> increases w/ centrality <T> slightly increases w/ centrality Can this be reproduced with the present simulations? …apply an STAR filter to the UrQMD events B. Abelev et al. (STAR Collaboration), PRC 79 (2009) 34909
Effect of acceptance on Thermus parameters in UrQMD events 0-5% 60-80% 7.7 200
Summary UrQMD events can be reasonably fit with Thermus throughout the time evolution of single events, even at times as early as a few fm/c (!) Variances of the mB distributions in tightly (5%-wide) centrality-selected events is apparently quite large (~200 MeV for √sNN ≤ 30 GeV) Implication is that finer steps in beam energy (except for ~15GeV, this run!) are not what we need now. What is needed is more events, and if possible, improved detectors (iTPC upgrade). Events can be sorted by apparent mB based on event-by-event values of the pbar/p ratio… Study net-charge and net-Kaon moments gated on pbar/p directly… net-proton and total-proton moments can also be studied, but require a new baseline due to correlation of pbar/p and the multiplicity observable… Increasing <mB> values with icnreasing centrality measured by STAR in the GCE seem to be a reflection of the very narrow acceptance (|y|<0.1) used in this analysis. A “perfect detector” measuring everything from the participant zone would see <mB> and <T> decrease for increasing centrality.
net-p distributions vs y from NA49 top 7% central collisions… a very narrow rapidity slice at y=0 does not refect the whole participant zone
Filtered UrQMD+Thermus simulations… Apply “STAR” acceptance & efficiency filter to UrQMD Compare perfect, 4π, participant-only simulation results to those we measure E-by-E… refmult, refmult2 and refmult3 vs. impact parameter with and without the filter yields in |η|<0.5, PT>0.2 GeV, and including a parameterized tracking efficiency (parameterized tracking efficiencies from Evan Sangaline)
Example time dependence of the ratios, 19.6 GeV, 0-5% freezeout ~ 50 fm/c
Example time dependence of the ratios, 200 GeV, 0-5% freezeout ~ hundreds of fm/c
Fit Examples, UrQMD by root-s and centrality, Acceptance Filtered 60-80% 40-60% 20-40% 10-20% 5-10% 0-5% 7.7 200
μB from data+Thermus fits, Complete feeddown 200 7.7 general trend is as expected μB decreases w/ inc. root-s ~central μB distributions at a given root-s are wide and significantly overlap with data from neighboring root-s values 200 7.7
μB from data+Thermus fits, Zero feeddown 200 7.7 general trend is as expected μB decreases w/ inc. root-s ~central μB distributions at a given root-s are wide and significantly overlap with data from neighboring root-s values values ~10% smaller with zero feeddown compared to complete feeddown 200 7.7
data+Thermus fits, 0-5% central complete feeddown zero feeddown error bars here are the RMS values! (±1σ about mean) …same pbar/p=exp(-14μB) trend is seen when fitting the yields from the experimental data…
Constrain μS and γS and Fit (T, μB), GCE 0-5%, 5-10%, 10-20% give ~same T distributions… <T> decreases as b decreases…
Constrain μS and γS and Fit (T, μB), GCE double peaks disappear… still significant overlap in 0-5%, 5-10%, 10-20%... µBdecreases as b decreases…
Constrain μS and γS and Fit (T, μB), GCE, Event-Avg Trajectories look quite different at low root-s compared to free 4 parameter fits… FO µBdecreases as b decreases…
NDOF For N non-zero yields, one can form ratios… i.e. for π±,K±,p± –> up to N=6 non-zero yields –> 15 non-zero ratios possible Of these 15 non-zero ratios from N non-zero yields, N-1 are independent… I am only fitting events if N-1 ≥ Npar Evan’s simulation: how probable is it to measure b if normal distributed with means m and covariance C. (b-m)TC-1(b-m) is χ2 distributed with k DOF m = meas (vector with k values) b = model (vector with k values) C = meas covariance (k×k matrix) v = meas variances (diagonal of C) only yields…. k=5 measurements are independent plot diagonal-only χ2 sum all ratios…. plot diagonal-only χ2 sum for 5! ratios …mean~10, k-1<mean<5! mean~10 poor fit keff~5 closer to χ2 distribution w/ k-1 DOF then 5! DOF but not exactly the same
data+Thermus Used same Thermus code to fit experimental π±,K±,p± yield ratios event-by-event Yields from Daniel McDonald Detailed bad-run and bad-event rejection Same event and track cuts as he uses in his moments analyses Centrality from refmult2corr dE/dx+TOF plus spallation PT cut for p N=6 π±,K±,p± yields calculated for all directly identified tracks with |η|<0.5 But, BTW, there is a problem re: feeddown contributions to the observed yields…. Thermus can be run in two modes. - No Decays: i.e. Input yields do not include any feeddown contributions (this is how I appropriately run the UrQMD+Thermus simulations) - Allow Decays: i.e. Input yields include 100% of the possible feeddown from all particles known to Thermus (fit or not) with known branching fractions AFAIK, our data is not consistent with either case we can estimate feeddown but we don’t generally measure all the necessary parent yields or we can completely ignore feeddown, but there is typically a 1-3fm dca cut applied …I’ll just run Thermus in both modes and will provide both sets of results…
μB from data+Thermus fits: 0-5%, 5-10%, and 10-20% centrality only Here, using 4 parameter fits – which look fine in general – non-zero ratios are reproduced… DK off (zero feeddown) DK on (complete feeddown) general trend is as expected μB decreases w/ increasing root-s essentially no difference between 0-5%, 5-10%, and 10-20%
Centrality dependence of T b-dependence is weak multiple bands at low root-s result from “0,1 antibaryon”
Centrality dependence of μB b-dependence is weak multiple bands at low root-s result from “0,1 antibaryon”
Approach and codes UrQMD 3.3p1 Default parameters, only set impact parameter range and ecmonly centrality set on impact parameter in “standard” percentages assuming bmax=14fm output in 1 fm/c timesteps in each event 500-800 timesteps total depending on root-s in each timestep, ignore spectators and count multiplicity of 20 different particles (light hadrons and hyperons) Thermus Standalone application that reads the UrQMD files and fits the multiplicity ratios in every timestep in every event Grand Canonical Ensemble, fit parameters: (T, μB, μS, γS) 9 or 12 ratios considered (π±, K±, p±, Λ±) Covariance from minuit, NDOF = Nyields - 1 Mult errors in each time step & evt taken as Poisson (~√N) – but not that important Also fit “averaged events” (in a given centrality bin) in each time step Can thus plot the trajectories of individual events in (μB,T) space plot the trajectories of averaged events in (μB,T) space plot the distributions of (T, μB, μS, γS) in centrality-selected events
Impact Parameters Codes run on the davinci farm at Rice, generally 50-100 nodes available each day… Run as many events through thermus as fits in 24hrs of wall clock time… Few 100s to few 1000s evts in each root-s and centrality bin…
Time Trajectories of “Average Events” peripheral collisions freezeout at higher (μB,T) than do central collisions
Fit Examples, UrQMD by root-s and centrality 60-80% 40-60% 20-40% 10-20% 5-10% 0-5% 7.7 200
Constrain μS and γS and Fit (T, μB), GCE In previously presented slides, (T, μS, μB, γS) were allowed to vary freely… Resulted in some events with γS pegged at 1, and others w/ low values and two peaks in μB for non-peripheral collisions at low root-s μSvs b and root-s from 4 par fits γSvs b and root-s from 4 par fits now constrain (μS, γS) values to the red curves and fit only (T, μB)….