Download
1 / 11
110 likes | 309 Views
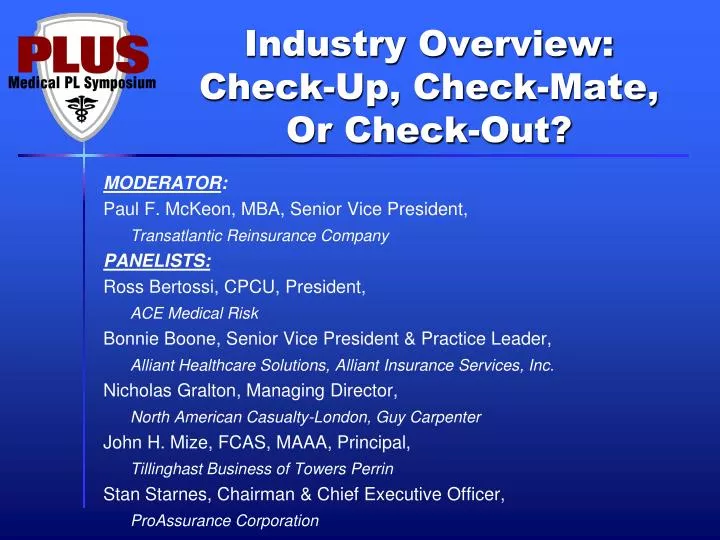
Industry Overview: Check-Up, Check-Mate, Or Check-Out?. MODERATOR : Paul F. McKeon, MBA, Senior Vice President, Transatlantic Reinsurance Company PANELISTS: Ross Bertossi, CPCU, President, ACE Medical Risk Bonnie Boone, Senior Vice President & Practice Leader,

E N D
Industry Overview: Check-Up, Check-Mate, Or Check-Out? MODERATOR: Paul F. McKeon, MBA, Senior Vice President, Transatlantic Reinsurance Company PANELISTS: Ross Bertossi, CPCU, President, ACE Medical Risk Bonnie Boone, Senior Vice President & Practice Leader, Alliant Healthcare Solutions,AlliantInsurance Services, Inc. Nicholas Gralton, Managing Director, North American Casualty-London, Guy Carpenter John H. Mize, FCAS, MAAA, Principal, Tillinghast Business of Towers Perrin Stan Starnes, Chairman & Chief Executive Officer, ProAssurance Corporation
P/C Insurance Industry Combined Ratio, 2001-2009E As recently as 2001, insurers paid out nearly $1.16 for every $1 in earned premiums 120 115.8 Best combined ratio since 1949 (87.6) 110 107.5 103.3 101.2 101 100.8 100.1 98.4 100 95.7 92.6 90 2001 2002 2003 2004 2005 2006 2007 2008 2008* 2009F *Includes Mortgage & Financial Guarantee insurers. Sources: A.M. Best; Insurance Information Institute 2
P/C Net Income After Taxes1991-2009F ($ Millions)* 2001 ROE = -1.2% 2002 ROE = 2.2% 2003 ROE = 8.9% 2004 ROE = 9.4% 2005 ROE= 9.4% 2006 ROE = 12.2% 2007 ROAS1 = 12.3% 2008 ROAS = 1.1%* Insurer profits peaked in 2006 $65,777 $70,000 $61,940 $60,000 $44,155 $50,000 $36,819 $38,501 $40,000 $30,773 $30,029 $24,404 $21,865 $30,000 $20,598 $20,559 $19,316 $14,178 $20,000 $10,870 $5,840 $5,421 $3,046 $10,000 $0 -$6,970 -$10,000 05 06 07 94 95 96 97 98 99 00 01 02 91 92 93 03 04 08F *ROE figures are GAAP; 1Return on avg. surplus. 2008 numbers are annualized based on 9-mos. Actual of $4.066 billion. Sources: A.M. Best, ISO, Insurance Information Institute 3
Year-to-Year Change in Net Written Premium, 2000-2009F* P/C insurers are experiencing their slowest growth rates since 1930-33 15.3% 10.0% 8.4% 5.0% 4.2% 3.9% 0.5% 0.9% -0.4% -1.0% 2000 2001 2002 2003 2004 2005 2006 2008F 2009F 2007 4 *2008 figure is 9-month actual result from ISO. Source: A.M. Best (historical and forecast), Insurance Information Institute
Policyholder Surplus, 2006 – 2008 (Est.) Capacity peaked at $521.8 as of 9/30/07 Declines Since 2007:Q3 Peak Q4E: -$84B (-16.1%) $ Billions $540 $517.9 $521.8 $515.6 $512.8 $520 $505.0 $496.6 $500 $487.1 $478.5 $480 $460 $438.0 $440 $420 $400 $380 06:Q4 07:Q1 07:Q2 07:Q3 07:Q4 08:Q1 08:Q2 08:Q3 08:Q4 Source: Insurance Information Institute; ISO (historical); Towers Perrin (Oct. 21) estimates for Q4 2008. Q4 assumes no major investment market recovery before year-end 2008. 5
Cumulative Rate DecreasesA Small Sample Policy Year 0% 2004 2005 2006 2007 2008 -10% -20% -30% Average Rate Change -40% -50% -60% -70% A B C D -80% 4 separate multi-facility healthcare systems
Rate Decrease and Syndication Policy Year 0% 8 2004 2005 2006 2007 2008 -5% 7 -10% 6 -15% -16% # Carriers Average Rate Change -20% 4.8 5 4.5 4.3 -25% 4.0 4 3.5 -30% -32% -35% 3 -37% -40% -40% 2 -43% -45% -50% 1
ROE vs. Equity Cost of Capital:US P/C Insurance:1991-2008:Q3 18% 16% 14% 12% 10% -13.2 pts -9.7 pts 8% 6% 4% The cost of capital is the rate of return insurers need to attract and retain capital to the business 2% 0% -2% -4% 96 97 91 92 93 94 95 98 99 00 01 02 03 04 05 06 07 08* ROE Cost of Capital 8 *Excludes mortgage and financial guarantee insurers Source: The Geneva Association, Insurance Information Institute
P/C Insurance Industry ROEs,1975 – 2010F* 25% 1977:19.0% 1987:17.3% 20% 1997:11.6% 2006:12.2% 15% 10% 5% 0% -5% 83 89 91 93 95 96 97 98 06 84 85 86 87 88 90 92 94 07 82 99 75 76 78 80 81 00 77 79 01 02 03 04 05 08F 1984: 1.8% 1992: 4.5% 2001: -1.2% 1975: 2.4% Note: 2009 figure is actual 9-month result Sources: ISO;Insurance Information Institute 9
Issues that Health Care providers are concerned with: Expenses are reduced, however, all of our clients have stressed that their Patient Safety efforts will not be comprised. Medicare and Medicaid reimbursement and bad debt Balance sheet and asset issues - no more investment income Difficulty in acquiring capital or credit Bond issues to support capital growth There are less elective surgeries More strain on Emergency Rooms as the public losses their jobs - the strain of the uninsured. Construction Operations have been halted Personnel shortages as a result of lay-offs What affects the financial crisis has on Healthcare clients?
Combat the financial crisis from a risk transfer perspective From a risk transfer perspective here are some of the issues that can be addressed to combat the financial crisis: • Make sure all of the carriers are AM Best rated. Also, provide S&P and Moody’s information to your clients. • Arrange meetings to develop a strategy. How much risk can they assume? Will they need to reduce limits? If they have a captive, discuss the financials of the captive. When the market begins to turn or stabilize insured's/clients will be concerned about the stability of carriers. One way to address this is to syndicate your placements. Don’t put all of your eggs in one basket, with regards to limits of liability.