Download
1 / 87
870 likes | 1.04k Views
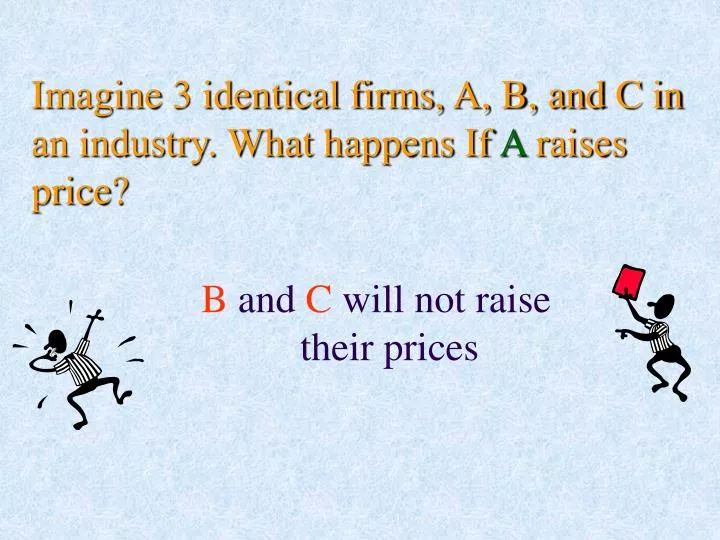
Imagine 3 identical firms, A, B, and C in an industry. What happens If A raises price?. B and C will not raise their prices. Imagine 3 identical firms in an industry A, B, C what happens If A lowers price?. B and C will lower their prices. The Kinked Demand Curve Model:. Price. P. 0.

E N D
Imagine 3 identical firms, A, B, and C in an industry. What happens If A raises price? BandCwill not raise their prices
Imagine 3 identical firms in an industry A, B, C what happens If A lowers price? Band Cwill lower their prices
The Kinked Demand Curve Model: Price P 0 Q Quantity
The Kinked Demand Curve Model: Price P 0 Q Quantity
Price P 0 Q Quantity
Price P 0 Q Quantity
Brand Multiplication: Variations of essentially one good that a firm produces to increase its market share. Firm’s Market Share = (Number of Brands) x (Brand’s Market Share)
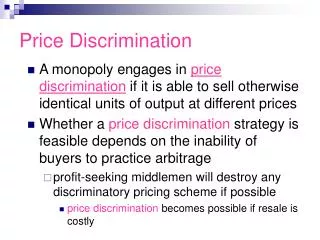
Price Discrimination : The practice of offering a specific good or service at different prices to differentsegments of the market.
Centralized Cartels: MC2 MC1 P P P D MR 0 q1 0 q2 0 Q
Chapter 19 Aggregate Demand and Aggregate Supply
Macro Issues: • How do we measure a nation’s performance? By the value of aggregate output produced by the economy in a given year or by its GDP. Formal Definition of GDP: GDP stands forGross Domestic Product. It represents the total value, measured incurrent prices, of allfinalgoods and services,produced in the economyduring a given year.
Macro Issues: • How do we measure a nation’s performance? • Why do nations grow (Economic Growth)? • Why is there unemployment? • Why is there inflation? • Why does the economy perform well in some years and does very bad in others?
What is the Business Cycle? Alternating periods of growth and decline in an economy’soutput.
Stages of the Business Cycle? • Recession • Trough • Recovery • Prosperity • Peak or Boom • Downturn
Trend Output Peak Downturn Prosperity Recovery Time Recession Trough
Recession: A phase in the business cycle in which the decline in the economy’s GDP persists for at least a half-year. A recession is marked by relatively high unemployment. Depression: A relatively long and deep recession is described as a depression.
Prosperity: A phase in the business cycle marked by relatively high level of real GDP, near full employment and inflation. What is Inflation? An increase in the price level
Basic Macro Questions: • Can we harness the disturbing swings in our business cycle? This implies, can we moderate the inflationary pressures on the economy when it is on the upswing of the buseiness cycle, pressing upon full employment? Can we moderate the inevitable unemployment that occurs when the economy after reaching its peak, begins its slide into recession? • Can we learn how to engineer an attractive rate of economic growth?
GDP: GDP orGross Domestic Productis the total value, measured incurrent prices, of allfinalgoodsand services,produced in the economy,during a given year.
What is a Final Good? A good that is not itself used to produce other goods.
Example: = 100 bushels Direct Consumption = 80 Bushels 20 Bushels = 2000 pies
What does “produced in the economy” mean? It is produced domestically or within the geographic boundary of the country.
What does “measured in current market prices” mean? valued at a price that existed in the year in which the good was made.
What is Nominal GDP? GDP measured in terms of current market prices - it is not adjusted for inflation.
1997 X $2 = $200 = 100 bushels 2000 X $4 = $400 = 100 bushels
What is Real GDP? GDP adjusted for changes in the price level
Price Indexes: The Consumer Price Index (CPI): Base Year: Lets assume 1980 is our base year CPI in the Base Year is = 100 Price of Consumer Basket in Base Year, 80 = $300 Price of the Consumer Basket in 1999, P99 = $450
CPI for 1999 = 150 Suppose the Nominal GDP in 1999 was 800 billion $. What is the real GDP in 1980 prices? 533.33 billion $
GDP Deflator: Like the CPI it is also a price index. However the composition of the items in the consumption basket is different. Instead of only including consumption items, the basket now also includes farm goods, producer goods, crude materials, services, capital equipment and export goods. The basket here is known as Market Basket.
Converting Nominal GDP to Real GDP Base Year 1992
Converting Nominal GDP to Real GDP Base Year 1992
GDP Growth Rate: It is the percentage change in GDP GDP Growth Rate Real GDP Growth Rate
Aggregate Demand and Supply Model Aggregate Supply:It is the total quantity of goods and services that firms in the economy are willing to supply at varying price levels.
Aggregate Supply Curve: Price Level Vertical Segment Horizontal Segment Upward-Sloping Segment 0 Real GDP
Aggregate Demand It is the total quantity of goods and services demanded by households, firms, foreigners and government at varying price levels.
Aggregate Demand Curve: Price Level 0 Real GDP
What factors explain Aggregate Demand? • Real wealth affect • Interest rate effect • International trade effect
What factors cause a shift in Aggregate Demand? A change in ... • government spending • taxes • income abroad • expectations
Aggregate Demand Curve: Price Level 0 Real GDP
What factors cause a shift in Aggregate Supply? A change in ... • resource availability • wages • interest rates • rents
Aggregate Supply Curve: Price Level 0 Real GDP
Macroeconomic Equilibrium: AS Price Level Excess Supply 110 4.5 7.1 0 Real GDP
Macroeconomic Equilibrium: AS Price Level 90 4.6 7.1 Excess Demand 0 Real GDP
Macroeconomic Equilibrium: AS Price Level 102 6.3 0 Real GDP
AS' The Depression of the 30s: AS Price Level d c b a 0 Real GDP
The Vietnam War: AS Price Level b a 0 Real GDP
Demand-Pull Inflation Inflation caused primarily by an increase in aggregate demand
Cost-Push Inflation: The OPEC Legacy In October 1973, the price of Arabian light crude oil was$2.10per barrel. By Nov 74, OPEC had cut oil production substantially and raised the price to$10.46. By Jan 79, the price had drifted upward to$13.34and by April 1980, OPEC had raised the price to$28and by Jan 1982 to$34.
AS' The OPEC Influence: AS Price Level b a 0 Real GDP