Download
1 / 31
310 likes | 473 Views
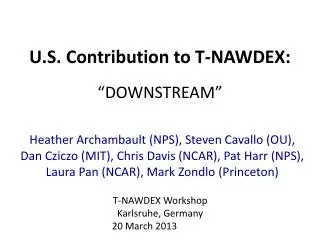
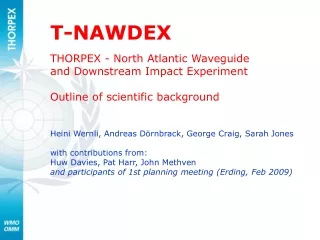
T-NAWDEX-Falcon 2012. A Lagrangian experiment to quantify diabatic processes in a WCB and their potential role for forecast errors associated with mid-latitude weather systems. Andreas Schäfler Maxi Boettcher, Andreas Dörnbrack, Florian Harnisch and Heini Wernli. Outline.

E N D
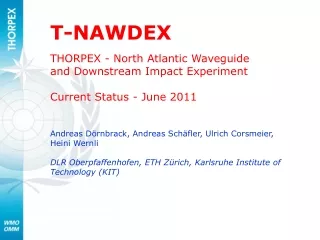
T-NAWDEX-Falcon 2012 A Lagrangian experiment to quantify diabatic processes in a WCB and their potential role for forecast errors associated with mid-latitude weather systems Andreas Schäfler Maxi Boettcher, Andreas Dörnbrack, Florian Harnisch and Heini Wernli University of Reading 18-20 June 2012
Outline Lidar Observations of warm conveyor belts - a TPARC Case Study • Moisture observations • WCB identification • Moisture error diagnostics and data assimilation • Impact on analysis and FC T-NAWDEX-Falcon • Idea and main objectives • General information and payload • Climatology and flight strategies • FC products and preparation THORPEX ICSC PDP Working Group 5th Meeting - A. Schäfler - 19 June 2012 - Chart 2
DLR Falcon Payload u,v,w,TAS T,P,q Dropsondes: u,v, P,T,q DIAL: H2O/ Aerosols Doppler Wind Lidar Recent and ongoing work PHD thesis Are any of airborne lidar observations of past field experiments suitable to characterize the inflow of WCBs? Where does the moisture in the inflow of a WCB originate? How do analysis errors in the humidity fields of a WCB inflow impact the subsequent forecast? PANDOWAE project 2nd phase DIAP Characterize the role of diabatic processes for the evolution of mid-latitude weather systems TNAWDEX-Falcon THORPEX ICSC PDP Working Group 5th Meeting - A. Schäfler - 19 June 2012 - Chart 3
TPARC Case Study – Synoptic Overview 850 hPa Geopotential & eq. pot. T. 500 hPa Geopotential & Wind Speed MTSAT satellite imagery (VIS, Chanel 1) 00 UTC 19 Sep 2012 00 UTC20 Sep 2012 (+24h) THORPEX ICSC PDP Working Group 5th Meeting - A. Schäfler - 19 June 2012 - Chart 4
TPARC Case Study – Observations Specific humidity Maximum ascent in 48 hours ? Schäfler, A., A. Dörnbrack, H. Wernli, C. Kiemle, and S. Pfahl, 2011: Airborne lidar observations in the in inflow region of a warm conveyor belt. Q. J. R. Meteorol. Soc.,137: 1257-1272. THORPEX ICSC PDP Working Group 5th Meeting - A. Schäfler - 19 June 2012 - Chart 5
TPARC Case Study – WCB Identification Locations of lidar observations with an ascent larger than 400 hPa in 48 hours. start time of the ascent (relative to the observation time) magnitude of the maximum decrease of pressure in 48 hours THORPEX ICSC PDP Working Group 5th Meeting - A. Schäfler - 19 June 2012 - Chart 6
TPARC Case Study – WCB Identification Alaska Japan THORPEX ICSC PDP Working Group 5th Meeting - A. Schäfler - 19 June 2012 - Chart 7
TPARC Case Study – Moisture Errors Absolute differences of ECMWF model fields and lidar water vapor observations With additionally assimilating the DIAL data(EXP_DIAL) All conventional data (EXP_CTRL) Harnisch, F., M. Weissmann, C. Cardinali, and M. Wirth, 2011: Experimental assimilation of DIAL water vapour observations in the ECMWF global model. Q. J. R. Meteorol. Soc., 137, 1532-1546. THORPEX ICSC PDP Working Group 5th Meeting - A. Schäfler - 19 June 2012 - Chart 8
TPARC Case Study – Moisture Errors Absolute differences (EXP_DIAL – EXP_CTRL) of specific humidity (g kg-1) at 850 hPa analysis at 00 UTC 19 September 2008 +12 h forecast THORPEX ICSC PDP Working Group 5th Meeting - A. Schäfler - 19 June 2012 - Chart 9
TPARC Case Study – Impact on the FC Distribution of (a) pressure, (b) potential temperature, (c) specific humidity and (d) PV for WCB trajectories driven by the EXP_CTRL (blue) and EXP_DIAL (orange) • Reduced latent heat release at lower levels • Weaker lifting and vertical displacement in the WCB (lower outflow) • Less PV production at lower levels and transport of higher PV values THORPEX ICSC PDP Working Group 5th Meeting - A. Schäfler - 19 June 2012 - Chart 10
TPARC Case Study – Impact on the FC Differences (EXP_DIAL – EXP_CTRL) of geopotential height at +36 h forecast time. 500 hPa 300 hPa • geopotential height differences amplify and propagate vertically • weaker cyclone in the FC with weaker WCB (EXP_DIAL) • stronger ridging to the FC with stronger WCB (EXP_CTRL) THORPEX ICSC PDP Working Group 5th Meeting - A. Schäfler - 19 June 2012 - Chart 11
TPARC Case Study – Impact on the FC PV and wind on the 322 K isentrope +36 h for forecast. EXP_CTRL EXP_DIAL 500 hPa THORPEX ICSC PDP Working Group 5th Meeting - A. Schäfler - 19 June 2012 - Chart 12
TPARC Case Study – Summary • Data assimilation reduced moist BIAS in the WCB inflow • A reduced amount of moisture is lifted in the WCB • Less PV produced due to the reduced latent heat release • Lower outflow of the WCB • Weaker cyclone with lower local tropopause and weaker jet stream • Forecast verification against OP AN shows an improvement of the PV structure at low and mid-levels • Positive impact on the dynamic structure of the cyclone • Weak downstream and medium range impact after the cut-off of the cyclone 500 hPa THORPEX ICSC PDP Working Group 5th Meeting - A. Schäfler - 19 June 2012 - Chart 13
Contents Lidar Observations of warm conveyor belts - a TPARC Case Study • Moisture observations • WCB identification • Moisture error diagnostics and data assimilation • Impact on analysis and FC T-NAWDEX-Falcon • Idea and main objectives • General information and payload • Climatology and flight strategies • FC products and preparation THORPEX ICSC PDP Working Group 5th Meeting - A. Schäfler - 19 June 2012 - Chart 14
T-NAWDEX-Falcon • HALO implementation delayed, first demo missions in 2012 (TACTS) • → idea: use DLR Falcon for T-NAWDEX pilot campaign • → joint effort ETH and DLR with attempt to coordinate with HYMEX • considered as a test for a future T-NAWDEX experiment with a well-defined scientific objective • focus on processes at the downstream end of the Atlantic waveguide (eastern N-Atlantic, Central Europe and the W-Med) • synergy with the German research group PANDOWAE • experiment is planned for October 2012 THORPEX ICSC PDP Working Group 5th Meeting - A. Schäfler - 19 June 2012 - Chart 15
T-NAWDEX-Falcon – Scientific Background • despite general improvement of NWP during the last decades, but still exist error sources affecting the skill of the NWP • forecast errors could be traced back to an inaccurate representation of diabatic effects, which eventually altered the upper tropospheric flow and resulted in an erroneous prediction of propagating Rossby waves • strong diabatic processes typically occur within WCBs • insufficient representation can impact the FC quality →evaluate the accuracy of diabatic processes in numerical weather predictions and identify potential inaccuracies in the initial conditions and/or the model physics THORPEX ICSC PDP Working Group 5th Meeting - A. Schäfler - 19 June 2012 - Chart 16
T-NAWDEX-Falcon – Main Objectives • In-situ observations to observe in-cloud diabatic processes and the transport of water vapour • Observations in the region where the WCB reaches the tropopause and impacts on the triggering and amplification of wave-guide disturbances • for the first time conduct a tracer experiment in the surrounding of a WCB: • artificial PCF tracer release in the WCB inflow region and • at later times try to recover the tracer along the WCB ascent • to verify the accuracy of the Lagrangian flight planning based upon forecast data and studying the diabatic modification of the ascending WCB flow. • Measure net latent heating along the WCB to compare with the representation in NWP systems. THORPEX ICSC PDP Working Group 5th Meeting - A. Schäfler - 19 June 2012 - Chart 17
T-NAWDEX-Falcon – General Information and Payload Experiment phase: 24 September – 18 October 2012 Operation Centre: DLR Oberpfaffenhofen ICAO code: EDMO Resources DLR Falcon: 30 h in total during 25 days 9 mission flights, 1 test flight Cessna: 20 h in total during 10 days THORPEX ICSC PDP Working Group 5th Meeting - A. Schäfler - 19 June 2012 - Chart 18
T-NAWDEX-Falcon – General Information and Payload DLR-Falcon • Altitude: 3000 – 12000 m • Endurance: 3-5 h flight time • Range: 2000 – 3700 km • 50 dropsondes Cessna-208B Grand Caravan • Altitude: 3000 m • Endurance: 6 h • Range: 1000 km • No flights in icy conditions, not over sea THORPEX ICSC PDP Working Group 5th Meeting - A. Schäfler - 19 June 2012 - Chart 19
T-NAWDEX-Falcon – General Information and Payload THORPEX ICSC PDP Working Group 5th Meeting - A. Schäfler - 19 June 2012 - Chart 20
T-NAWDEX-Falcon – WCB Climatology • ERA-Interim WCB climatology: WCB trajectories within an area of 2000 km around the Falcon air base Oberpfaffenhofen were considered. • In October 64 WCB cases in 11 years were found (6 per year) • 39 started over the eastern North Atlantic with a typical ascent along the European west coast • 14 also associated with majorNA cyclones large-amplitude flow but inflow over the Mediterranean • 11 caused by smaller-scale cyclones in the Mediterranean THORPEX ICSC PDP Working Group 5th Meeting - A. Schäfler - 19 June 2012 - Chart 21
T-NAWDEX-Falcon – Flight Strategies • tracer release from Cessna within WCB inflow located in PBL • Falcon flight in WCB inflow region t0+6h: in–situ observation and tracer samples • return flight with dropsonde observations t0+12h • upper level observations t0+48h THORPEX ICSC PDP Working Group 5th Meeting - A. Schäfler - 19 June 2012 - Chart 22
T-NAWDEX-Falcon – Flight Strategies Tracer release • PFC tracer: chemically inert, no natural sources • study transport, tag airmasses • not possible to release from Falcon: cabin decontamination • collect air samples with Falcon THORPEX ICSC PDP Working Group 5th Meeting - A. Schäfler - 19 June 2012 - Chart 23
T-NAWDEX-Falcon – Flight Strategies Diabatic Processes Flight 2 Flight 1 ~150 km ~200 km FL 340 FL 340 ~150 km ~200 km profiles 1-3 km profiles 1-3 km • Characterisation of clear/cloudy air, environmental conditions • Water vapour (in situ, dropsonde) • Temperature (in situ, dropsonde) • Pressure • Wind fields (vertical velocity) • Trace gas fields (in situ) THORPEX ICSC PDP Working Group 5th Meeting - A. Schäfler - 19 June 2012 - Chart 24
T-NAWDEX-Falcon – Flight Strategies Waveguide Interaction Flight 3 FL 220-340 THORPEX ICSC PDP Working Group 5th Meeting - A. Schäfler - 19 June 2012 - Chart 25
T-NAWDEX-Falcon – Preparation • Case studies: learn from simulated measurements, precise flight strategies • Instrumentation: chance for microphysical measurements? • 2nd planning meeting 2/3 July 2012 at DLR • Discuss side objectives • Develop forecasting tools THORPEX ICSC PDP Working Group 5th Meeting - A. Schäfler - 19 June 2012 - Chart 26
Bremen/ Karlsruhe Shannon NL London B Langen/ Karlsruhe Shanwick Oceanic München D D Paris Paris Reims Reims Wien Wien Zürich Zürich T-NAWDEX-Falcon – Preparation Brest Brest Ljubljana Milan Bordeaux Bordeaux Milan Zagreb Sta. Maria Oceanic Flight permissions and dropsonde permission Marseille Madrid Brindisi Barcelona Rom Lisbon Algier Malta Tunis Casablanca THORPEX ICSC PDP Working Group 5th Meeting - A. Schäfler - 19 June 2012 - Chart 27
Thank You! THORPEX ICSC PDP Working Group 5th Meeting - A. Schäfler - 19 June 2012 - Chart 28
TPARC mission on 19 September 2008 – WCB identificationImpact on the forecast Cross section at 56 ̊ N at 12 UTC 20 September 2008 (+36h): PV differences DIAL-CTRL 2PVU PV (b) DIAL (c) CTRL
TPARC mission on 19 September 2008 – WCB identificationImpact on the forecast skill Forecast impact at +24h 550 to 900 hPa vertically averaged PV kinetic energy norm
TPARC mission on 19 September 2008 – WCB identificationImpact on the forecast skill Averaged forecast impact 550 to 900 hPa vertically averaged PV-Norm (solid grey line) kinetic energy norm (solid black line) 250 hPa (dotted), 500 hPa (dashed) and 850 hPa (dash-dotted black line)