Download
1 / 1
10 likes | 159 Views
An investigation of the effects of water purity on ice spike formation. Jacob M. Canfield Ames High School, Ames, Iowa. Introduction

E N D
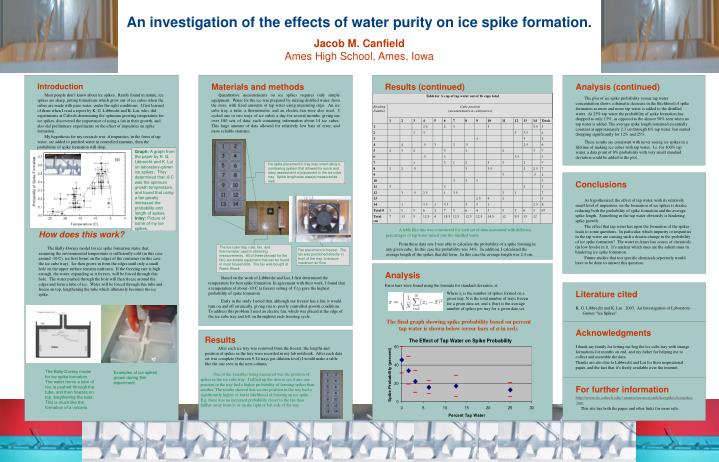
An investigation of the effects of water purity on ice spike formation. Jacob M. CanfieldAmes High School, Ames, Iowa Introduction Most people don’t know about ice spikes. Rarely found in nature, ice spikes are sharp, jutting formations which grow out of ice cubes when the cubes are made with pure water, under the right conditions. I first learned of them when I read a report by K. G. Libbrecht and K. Lui, who, did experiments at Caltech determining the optimum growing temperature for ice spikes, discovered the importance of using a fan in their growth, and also did preliminary experiments on the effect of impurities on spike formation. My hypothesis for my research was: if impurities, in the form of tap water, are added to purified water in controlled amounts, then the probability of spike formation will drop. Materials and methods Quantitative measurements on ice spikes requires only simple equipment. Water for the ice was prepared by mixing distilled water, from the store, with fixed amounts of tap water using measuring cups. An ice cube tray, a ruler, a thermometer, and an electric fan were also used. I cycled one or two trays of ice cubes a day for several months, giving me over 100 sets of data, each containing information about 14 ice cubes. This large amount of data allowed for relatively low bars of error, and more reliable statistics. Results (continued) Analysis (continued) The plot of ice spike probability versus tap water concentration shows a dramatic decrease in the likelihood of spike formation as more and more tap water is added to the distilled water. At 25% tap water the probability of spike formation has dropped to only 13%, as opposed to the almost 50% seen when no tap water is added. The average spike length remained essentially constant at approximately 2.3 cm through 6% tap water, but started dropping significantly for 12% and 25%. These results are consistent with never seeing ice spikes in a lifetime of making ice cubes with tap water. I.e. for 100% tap water, a data point of 0% probability with very small standard deviation could be added to the plot. Graph: A graph from the paper by K. G. Libbrecht and K. Lui on laboratory-grown ice spikes. They determined that -8 C was the optimum growth temperature, and found that using a fan greatly increased the probability and length of spikes. Inlay: Picture of some of my ice spikes. Ice spike placement in tray was noted using a numbering system that allowed for quick and easy assessment of placement in the ice cube tray. Spike length was always measured as well. Conclusions As hypothesized, the effect of tap water, with its relatively small level of impurities, on the formation of ice spikes is drastic, reducing both the probability of spike formation and the average spike length. Something in the tap water obviously is hindering spike growth. The effect that tap water has upon the formation of the spikes leads to some questions. In particular, which impurity or impurities in the tap water are causing such a drastic change in the probability of ice spike formation? The water in Ames has scores of chemicals (in low levels) in it. It’s unclear which ones are the salient ones in hindering ice spike formation. Future studies that test specific chemicals seperately would have to be done to answer this question. How does this work? The Bally-Dorsey model for ice spike formation states that, assuming the environmental temperature is sufficiently cold (in this case around -10 C), ice first forms on the edges of the container (in this case the ice cube tray). Ice then grows in from the edges until only a small hole on the upper surface remains unfrozen. If the freezing rate is high enough, the water, expanding as it freezes, will be forced through this hole. The water pushed through the hole will then freeze around the edges and form a tube of ice. Water will be forced through this tube and freeze on top, lengthening the tube which ultimately becomes the ice spike. A table like this was constructed for each set of data associated with different percentages of tap water mixed into the distilled water. From these data sets I was able to calculate the probability of a spike forming in any given cube. In this case the probability was 34%. In addition, I calculated the average length of the spikes that did form. In this case the average length was 2.4 cm. The ice cube tray, ruler, fan, and thermometer used in obtaining measurements. All of these (except for the fan) are simple equipment that can be found in most households. The fan was bought at Radio Shack. Fan placement in freezer. The fan was positioned directly in front of the tray, to ensure maximum air flow. Analysis Error bars were found using the formula for standard deviation, s: Based on the work of Libbrecht and Lui, I first determined the temperature for best spike formation. In agreement with their work, I found that a temperature of about -10 C (a freezer setting of 11/2) gave the highest probability of spike formation. Early in the study I noted that, although our freezer has a fan, it would turn on and off erratically, giving rise to poorly controlled growth conditions. To address this problem I used an electric fan, which was placed at the edge of the ice cube tray and left on throughout each freezing cycle. Literature cited K. G. Libbrecht and K. Lui. 2003. An Investigation of Laboratory-Grown “Ice Spikes”. Where xi is the number of spikes formed on a given tray, N is the total number of trays frozen for a given data set, and x (bar) is the average number of spikes per tray for a given data set. The final graph showing spike probability based on percent tap water is shown below (error bars of s in red). Acknowledgments I thank my family for letting me hog the ice cube tray with strange formations for months on end, and my father for helping me to collect and assemble the data. Thanks are also due to Libbrecht and Lui for their inspirational paper, and the fact that it’s freely available over the internet. Results After each ice tray was removed from the freezer, the lengths and position of spikes in the tray were recorded in my lab notebook. After each data set was complete (between 9-14 trays per dilution level) I would make a table like the one seen in the next column. The Bally-Dorsey model for ice spike formation. The water forms a tube of ice, is pushed through the tube, and then freezes on top, lengthening the tube. This is much like the formation of a volcano. Examples of ice spikes grown during this experiment. One of the variables being measured was the position of spikes in the ice cube tray. I tallied up the data to see if any one position in the tray had a higher probability of forming spikes than another. The results showed that no one position in the tray had a significantly higher or lower likelihood of forming an ice spike. E.g. there was no increased probability closer to the fan than farther away from it, or on the right or left side of the tray. For further information http://www.its.caltech.edu/~atomic/snowcrystals/icespikes/icespikes.htm This site has both the paper and other links for more info.