Download
1 / 14
140 likes | 237 Views
Two Sample Project Example. 5/6/2013 Ms. Browne made this up Saber metrics: TX Rangers vs. SF Giants. Table of Contents. Abstract – Slides 3-4 Explanation of Project – Slides 5-7 Methods – Slide 9 Analysis – Slide 10 Problems in the Project – Slide 11

E N D
Two Sample Project Example 5/6/2013 Ms. Browne made this up Saber metrics: TX Rangers vs. SF Giants
Table of Contents • Abstract – Slides 3-4 • Explanation of Project – Slides 5-7 • Methods – Slide 9 • Analysis – Slide 10 • Problems in the Project – Slide 11 • Discussion and Conclusions – Slide 12 • Appendices – Slide 13 • Works Cited – Slide 14
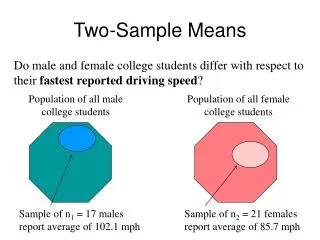
Abstract Motivation: The San Francisco Giants met the Texas Rangers in the 2010 world series. Although the Giants were victorious, many would argue that the Rangers were the better team. Methods: The data used in this research was obtained from BaseballReference.com. A comparison of On Base Percentage (OBP) for the top 11 players on each team was used in my calculations. I tested the claim that the average OBP for players on the Rangers is greater than for the average player on the Giants team.
Abstract Results: I was able to Reject the Null hypothesis. So there is enough evidence to show that the Rangers are significantly better than the Giants in terms of on base percentage. Conclusions: The Texas rangers did not win the world series in 2010, but they are still a fantastic team. Statistics are a great way to make comparison’s between players, but there is a reason the game is played. Even a statistically better team can sometimes lose the game.
Explanation of Project • Sabermetrics is a system created to analyze baseball performance through the use of statistics. • The term is derived from the acronym SABR, which stands for the Society for American Baseball Research.
Explanation of Project • Billy Beane and Paul DePodesta, general manager and assistant of the Oakland A’s became famous in 2002 for using players on-base (OBP) as the main gauge for determining the ability of a hitter
Explanation of Project • At the time, this philosophy was innovative. • Traditionally, statistics like … • RBI (Runs Batted In) • Batting Average were popular measures of a hitters success.
Explanation of Project My goal for this project was to compare the top 11 OPB numbers for the following teams during 2010. • Texas Rangers • San Francisco Giants Is team with a greater average OBP the better team?
Methods • Existing records were used to conduct research for this project. All data from the starting line-up for each team during the 2010 season was used to conduct a hypothesis test. The top 11 hitters were used for each team and only the OBP statistics were used.
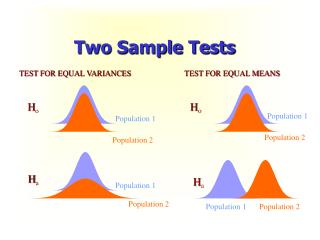
Analysis of Data • Is team with a greater average OBP the better team? H₀ : μ₁=μ₂ H₁: μ₁ > μ₂ TX Rangers SF Giants Reject, H₀
Problems in the project • There are may changes that could have been made to this project that could have changed the result. • Studying the top performing batters, might not also be the top performing players. • Additional statistics for players could have been considered as a more well rounded approach. • The pitching talent of the opposing team is also a factor in the outcome of hitting for a particular game. Other factors influence player performance including weather, fatigue, and psyche.
Discussion and Conclusion • The OBP for both teams, The SF Giants and the Texas Rangers were both fairly high. According to Steve Slowinski’s article, “OBP”. The SF Giants would have an average player rating of “Great”. Texas Rangers however, would have received a rating of “Excellent”. • While both teams have high OBP numbers, Slowinski’s article supports the results of hypothesis test that was conducted for this project. There is a significant difference between the SF Giants and The Texas Rangers, and the Rangers are the superior team.
The following ratings are based on Steve Slowinski’s article “OBP”
MLA Citation • Swingle, Andy. “Are Ball Parks the New Market Inefficiency?” SportsCardBlogs. 17 February 2012. • Slowinski, Steve. "OBP." Fan Graphs. 16 February 2006.