Download
1 / 12
120 likes | 465 Views
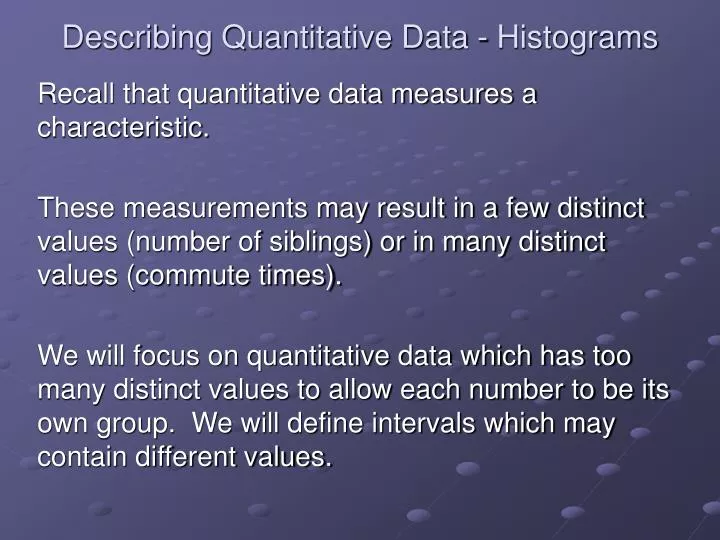
Describing Quantitative Data - Histograms. Recall that quantitative data measures a characteristic. These measurements may result in a few distinct values (number of siblings) or in many distinct values (commute times).

E N D
Describing Quantitative Data - Histograms Recall that quantitative data measures a characteristic. These measurements may result in a few distinct values (number of siblings) or in many distinct values (commute times). We will focus on quantitative data which has too many distinct values to allow each number to be its own group. We will define intervals which may contain different values.
Describing Quantitative Data - Histograms We will make a graph that is similar to a bar graph called a histogram. If we did this by hand our steps would be: define the intervals (determine a width) list the intervals and the number of data values in each interval in a table draw the histogram Each interval will have the same width. The frequency (or relative frequency as a percent) will determine the height of the rectangle.
Describing Quantitative Data - Histograms The histogram will look like a bar chart, but the intervals will be right next to each other. There may not be spaces between bars. Note: Spaces would actually be intervals with no observations, so technically, there is never space between bars in a histogram. We will use Minitab to produce histograms, so we will focus on interpreting the picture, rather than producing it by hand.
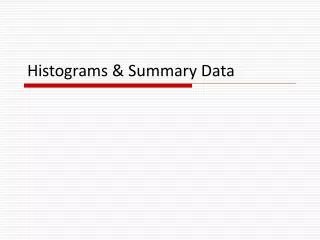
Histogram – Example #1 Suppose we examine the scores on the first test for students in MAT 205 from past semesters. Clearly this is quantitative data, and as such, a histogram of the scores is appropriate. Using Minitab, the following histogram was produced. Notice the bars are equal width, the heights of the bars give the number of scores in each interval, etc.
Histogram – Example #1 Questions There are many questions you should be able to answer from this type of graph. What are the largest and smallest values possible in the data set? Are there any unusual data points (called outliers)? Where do most values lie in the data set (if appropriate)? What is the shape of the histogram (if appropriate)?
Histogram – Example #1 Questions From the graph, the largest rectangle is centered at 100, and includes values from 95 to 105. Since I know the exam scores had a maximum of 100 points, I would conclude the largest values in the data set were somewhere between 95 to 100 points. Similarly, the smallest interval covers scores from 15 to 25. Hence, the lowest score on the exam was between 15 and 25 points. There are no data points by themselves, so I would say there are no atypical values (outliers).
Histogram – Example #1 Questions Most scores were between 75 and 95 as these were the tallest rectangles. The most frequent category has scores between 85 and 95. Notice how there is only 1 rectangle to the right of the 75 to 95 range, but there are 6 rectangles to the left of the 75 to 95 range. This indicates the data stretches farther to the left than to the right. We describe the shape as skewed to the left.
Skewed to the left Skewed to the right Symmetric
Section 2.4 - Definitions A population is the collection of all the data that could be observed in a statistical study. A sample is a collection of data chosen from the population of interest. It is some smaller portion of the population. An inference is a decision, estimate, prediction, or generalization about a population based on information contained in a sample from that population.
Section 2.4 - Examples Population All NKU students All voters enrolled during in the 2004 summer 2004 election Sample 500 NKU students 2500 voters enrolled during in the 2004 summer 2004 election Inference The mean time to About 45% drive to NKU is of voters 24 minutes favor Kerry.