Download
1 / 1
10 likes | 223 Views
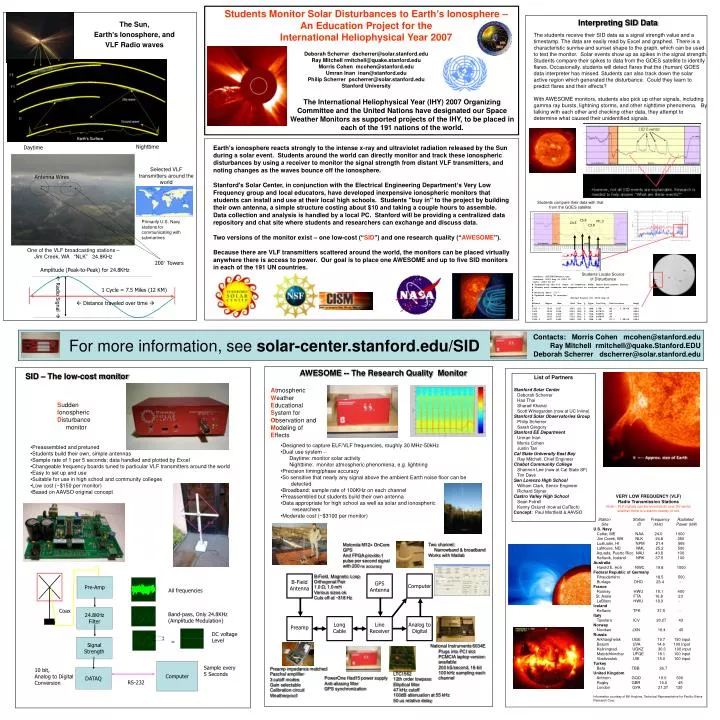
Students Monitor Solar Disturbances to Earth’s Ionosphere – An Education Project for the International Heliophysical Year 2007 Deborah Scherrer dscherrer@solar.stanford.edu Ray Mitchell rmitchell@quake.stanford.edu Morris Cohen mcohen@stanford.edu Umran Inan inan@stanford.edu

E N D
Students Monitor Solar Disturbances to Earth’s Ionosphere – An Education Project for the International Heliophysical Year 2007 Deborah Scherrer dscherrer@solar.stanford.edu Ray Mitchell rmitchell@quake.stanford.edu Morris Cohen mcohen@stanford.edu Umran Inan inan@stanford.edu Philip Scherrer pscherrer@solar.stanford.edu Stanford University Interpreting SID Data The Sun, Earth’s Ionosphere, and VLF Radio waves The students receive their SID data as a signal strength value and a timestamp. The data are easily read by Excel and graphed. There is a characteristic sunrise and sunset shape to the graph, which can be used to test the monitor. Solar events show up as spikes in the signal strength. Students compare their spikes to data from the GOES satellite to identify flares. Occasionally, students will detect flares that the (human) GOES data interpreter has missed. Students can also track down the solar active region which generated the disturbance. Could they learn to predict flares and their effects? With AWESOME monitors, students also pick up other signals, including gamma ray bursts, lightning storms, and other nighttime phenomena. By talking with each other and checking other data, they attempt to determine what caused their unidentified signals. C5.9 M1.3 C4.5 C3.8 The International Heliophysical Year (IHY) 2007 Organizing Committee and the United Nations have designated our Space Weather Monitors as supported projects of the IHY, to be placed in each of the 191 nations of the world. Nighttime Earth's ionosphere reacts strongly to the intense x-ray and ultraviolet radiation released by the Sun during a solar event. Students around the world can directly monitor and track these ionospheric disturbances by using a receiver to monitor the signal strength from distant VLF transmitters, and noting changes as the waves bounce off the ionosphere. Stanford's Solar Center, in conjunction with the Electrical Engineering Department’s Very Low Frequency group and local educators, have developed inexpensive ionospheric monitors that students can install and use at their local high schools. Students "buy in" to the project by building their own antenna, a simple structure costing about $10 and taking a couple hours to assemble. Data collection and analysis is handled by a local PC. Stanford will be providing a centralized data repository and chat site where students and researchers can exchange and discuss data. Two versions of the monitor exist – one low-cost (“SID”) and one research quality (“AWESOME”). Because there are VLF transmitters scattered around the world, the monitors can be placed virtually anywhere there is access to power. Our goal is to place one AWESOME and up to five SID monitors in each of the 191 UN countries. Daytime Selected VLF transmitters around the world Antenna Wires Students compare their data with that from the GOES satellite C5.9 Primarily U.S. Navy stations for communicating with submarines M1.3 C4.5 C3.8 One of the VLF broadcasting stations – Jim Creek, WA “NLK” 24.8KHz 200’ Towers Amplitude (Peak-to-Peak) for 24.8KHz Students Locate Source of Disturbance :Product: 20030802events.txt :Created: 2003 Aug 05 0302 UT :Date: 2003 08 02 # Prepared by the U.S. Dept. of Commerce, NOAA, Space Environment Center. # Please send comments and suggestions to sec@sec.noaa.gov # # Missing data: //// # Updated every 30 minutes. # Edited Events for 2003 Aug 02 # #Event Begin Max End Obs Q Type Loc/Frq Particulars Reg# #------------------------------------------------------------------------------- 1910 + 1529 1537 1545 G12 5 XRA 1-8A B8.1 6.3E-04 0424 1910 1533 1534 1553 HOL 3 FLA S17E71 SF 0424 1920 1604 1609 1617 HOL 3 FLA S18E70 SF 0424 1930 1625 1650 1726 HOL 3 FLA S18E68 SF 0424 1930 + 1637 1642 1650 G12 5 XRA 1-8A C1.1 7.6E-04 0424 Radio Signal 1 Cycle = 7.5 Miles (12 KM) Distance traveled over time Contacts: Morris Cohen mcohen@stanford.edu Ray Mitchell rmitchell@quake.Stanford.EDU Deborah Scherrer dscherrer@solar.stanford.edu For more information, see solar-center.stanford.edu/SID AWESOME -- The Research Quality Monitor SID – The low-cost monitor List of Partners Stanford Solar Center Deborah Scherrer Hao Thai Sharad Khanal Scott Winegarden (now at UC Irvine) Stanford Solar Observatories Group Philip Scherrer Sarah Gregory Stanford EE Department Umran Inan Morris Cohen Justin Tan Cal State University East Bay Ray Mitchell, Chief Engineer Chabot Community College Shannon Lee (now at Cal State SF) Tim Dave San Lorenzo High School William Clark, Senior Engineer Richard Styner Castro Valley High School Sean Fotrell Kenny Oslund (now at CalTech) Concept: Paul Mortfield & AAVSO Atmospheric Weather Educational System for Observation and Modeling of Effects Sudden Ionospheric Disturbance monitor • Designed to capture ELF/VLF frequencies, roughly 30 MHz-50kHz • Dual use system -- • Daytime: monitor solar activity • Nighttime: monitor atmospheric phenomena, e.g. lightning • Precision timing/phase accuracy • So sensitive that nearly any signal above the ambient Earth noise floor can be • detected • Broadband; sample rate of 100KHz on each channel • Preassembled but students build their own antenna • Data appropriate for high school as well as solar and ionospheric • researchers • Moderate cost (~$3100 per monitor) • Preassembled and pretuned • Students build their own, simple antennas • Sample rate of 1 per 5 seconds; data handled and plotted by Excel • Changeable frequency boards tuned to particular VLF transmitters around the world • Easy to set up and use • Suitable for use in high school and community colleges • Low cost (~$150 per monitor) • Based on AAVSO original concept VERY LOW FREQUENCY (VLF) Radio Transmission Stations Note – VLF signals can be received all over the world, whether there is a station nearby or not. Station Station Frequency Radiated Site ID (kHz) Power (kW) U.S. Navy Cutler, ME NAA 24.0 1000 Jim Creek, WA NLK 24.8 250 Lualualei, HI NPM 21.4 566 LaMoure, ND NML 25.2 500 Aquada, Puerto Rico NAU 40.8 100 Keflavik, Iceland NRK 37.5 100 Australia Harold E. Holt NWC 19.8 1000 Federal Republic of Germany Rhauderfehn - 18.5 500 Burlage DHO 23.4 - France Rosnay HWU 15.1 400 St. Assie FTA 16.8 23 LeBlanc HWU 18.3 - Iceland Keflavic TFK 37.5 - Italy Tavolara ICV 20.27 43 Norway Noviken JXN 16.4 45 Russia Arkhanghelsk UGE 19.7 150 input Batumi UVA 14.6 100 input Kaliningrad UGKZ 30.3 100 input Matotchkinchar UFQE 18.1 100 input Vladivostok UIK 15.0 100 input Turkey Bafa TBB 26.7 United Kingdom Anthorn GQD 19.0 500 Rugby GBR 16.0 45 London GYA 21.37 120 Information courtesy of Bill Hopkins, Technical Representative for Pacific-Sierra Research Corp. Two channel: Narrowband & broadband Works with Matlab Motorola M12+ OnCore GPS And FPGA provide 1 pulse per second signal with 200 ns accuracy B-Field, Magnetic Loop Orthogonal Pair 1.0 Ω, 1.0 mH Various sizes ok Cuts off at ~318 Hz Pre-Amp B-Field Antenna GPS Antenna Computer All frequencies Coax 24.8KHz Filter Band-pass, Only 24.8KHz (Amplitude Modulation) Long Cable Line Receiver Analog to Digital Preamp DC voltage Level Signal Strength = • National Instruments 6034E • Plugs into PCI slot • PCMCIA laptop version available • 200 kS/second, 16-bit • 100 kHz sampling each channel Computer Sample every 5 Seconds Preamp impedance matched Paschal amplifier 3 cutoff modes Gain selectable Calibration circuit Weatherproof 10 bit, Analog to Digital Conversion DATAQ LTC1562 12th order lowpass Elliptical filter 47 kHz cutoff 100dB attenuation at 55 kHz 50 us relative delay PowerOne Had15 power supply Anti-aliasing filter GPS synchronization RS-232