Download
1 / 13
130 likes | 223 Views
Correlations between Atlantic SST and drought conditions. Kristin McCallum EAS 4480 April 26, 2010. Introduction. Droughts effect every country world wide There has been several studies done on the connections of sea surface temperature anomalies and drought conditions world wide

E N D
Correlations between Atlantic SST and drought conditions Kristin McCallum EAS 4480 April 26, 2010
Introduction • Droughts effect every country world wide • There has been several studies done on the connections of sea surface temperature anomalies and drought conditions world wide • Attempted to correlate the two with the goal of being able to predict a drought in Georgia from a trend in the Sea surface temperature anomalies.
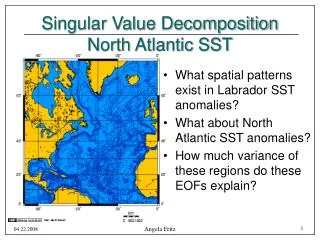
Data • From NOAA and National Climatic Data Center • Atlantic Multidecadal Ocean temperature anomalies are for monthly SST from 5.5N to 23.5N and 15W to 57.5W. • Precipitation anomalies are from AWAPS Climate program at NWS, Peachtree City, and are for that station. • Standardized Precipitation Index- based on the probability of recording a given amount of precipitation.
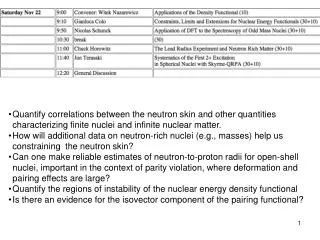
Methods • CPSD • Mscohere • Phase • Periodogram • T-test • F-test • Correlation coeffecent
Periodograms 7 and 9 15 3.5
Periodograms 9 7 27
Periodograms 1 15 5 3 27
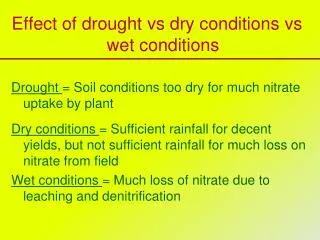
Conclusions • Time periods with a power spike at 3.75 years, with in the normal return period of ENSO, annual and 15-20 years, the cycle of AMO. • Researcher have found that there is a 25 yr cycle of drought in Georgia, but not dependent on only SSTs • Too many variables influencing drought to make a direct link between Sea Surface temperatures and either the Precipitation anomaly or the SPI. • Other Research has found that 52% of the droughts can be explained by PMO and AMO phase, but was found via PCA, beyond the scope of the class.
Sources • McCabe, Gregory J., Palecki, Michael, ‘Pacific and Atlantic Ocean influences on multidecadal drought frequency in the United States’,PNAS, Jan 2004. • Trauth, Martin H., “Matlab Recipes for Earth Sciences”, Springer, 2010. • NCDC • NOAA.org