Download
1 / 17
180 likes | 371 Views
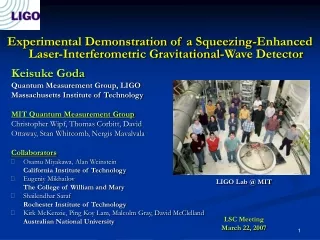
Application of LIGO Technology to Biomedical Optics Keisuke Goda Quantum Measurement Group @ MIT, LIGO Collaboration with MIT Spectroscopy Lab and Massachusetts General Hospital LIGO Seminar November 21, 2006 11AM. Outline.

E N D
Application of LIGO Technology to Biomedical Optics Keisuke Goda Quantum Measurement Group @ MIT, LIGO Collaboration with MIT Spectroscopy Lab and Massachusetts General Hospital LIGO Seminar November 21, 200611AM
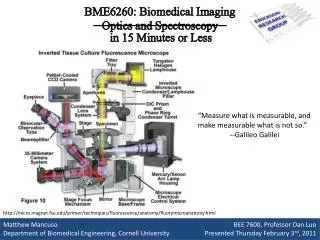
Outline • A quick report on my research on squeezing-enhanced gravitational-wave interferometers at 40m • Optical interferometry in biomedical optics • Quantitative imaging using interferometry • Measurement of surface tension of red blood cells by quantitative phase microscopy • How LIGO technology can be applied to biomedical optics
Squeezing-Enhanced GW Interferometers at 40m Goal: To Experimentally Demonstrate a Squeezing-Enhanced GW Interferometer in the Advanced LIGO Configuration in the GW Band • Interface to 40m • Squeezer based on MOPA Laser • Squeezed vacuum injected into the dark port via the circulator • Squeeze angle locked to reduce broadband shot noise • DRMI/RSE Quantum Noise Budget • Input Power to BS = 700mW • Homodyne Angle = 0 • Squeeze Angle = π/2 • Initial Squeezing Level = 5dB • Injection Loss = 10% • Detection Loss = 10%
Squeezing-Enhanced GW Interferometers at 40m Squeezed Vacuum PPKTP Seed Pump Optical Parametric Oscillator Input Coupler Output Coupler • Generation of Squeezed Vacuum • in Optical Parametric Oscillation • Vacuum seed squeezed in presence of pump in OPO • 2.2 cm OPO cavity with a PPKTP crystal in the middle • Squeezed vacuum injected to the dark port of the 40m IFO • Pump field generated by second-harmonic generation (SHG) • Squeezing Result • About 6.0 dB of scanned squeezing • About 4.5 dB of broadband squeezing/reduction of shot noise • Locking stability to be improved Injection of squeezed vacuum to the 40m IFO to be tested in a month or two..
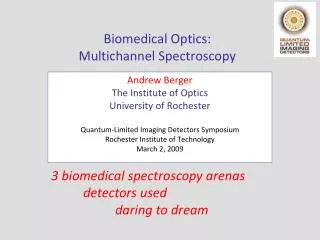
Optical Interferometry in Biomedical Optics • Optical Coherence Tomography (OCT) • Non-invasive optical tomographic (3D) imaging technique • Uses low-coherence interferometry(superluminescent diodes or femtosecond lasers as a light source) • mm penetration (approx. 2-3mm in tissue) • Sub-μm axial and lateral resolution • Invented by J. Fujimoto’s group at MIT in 1991[Huang et al., Science, 254, 5035 (1991), Drexler et al., Nature Medicine, (2001)] • Used in many biomedical applications, especially in ophthalmology and dermatology • Quantitative Phase Microscopy • Non-invasive phase imaging technique • Uses CW • Nanometer sensitivity • High contrast • Useful for investigation of cellar dynamics(motility, growth, membrane motion, etc)
Optical Coherence Tomography (OCT) • Interferometry with a low coherent light source • The light is split into and recombined from reference and sample arms. • The path-length of the reference arm is translated longitudinally. • Interference is achieved only when the path difference between the arms lies within the coherence length of the light source. Coherence length or axial resolution • ν0 = center frequency of the light source • Δν = FWHM • τ = optical time delay between the arms
Optical Coherence Tomography (OCT) Carl Zeiss Inc.
Quantitative Phase Imaging • Advantages over biochemical methods • Non-invasive • No preparation • Fast • Quantitative • Advantages over conventional microscopes • Quantitative • Cells are transparent →they are phase objects • High contrast • High axial sensitivity • High time resolution (high speed) Bright Field Phase Contrast Quantitative
Apparatus of Quantitative Phase Microscope • LASER: a few mW at 633nm • Fiber: mode-cleaner • Objective: 100X, NA = 1.2 • Transverse resolution: 0.3μm • Pinhole: low-pass filter • CCD: digital hologram • Post-processing on the computer Reference Arm is purposely misaligned to Sample Arm in one of the transverse directions to create a (spatially) high frequency fringe. T. Ikeda, G. Popescu, R. R. Dasari, and M. S. Feld, Opt. Lett., 30, 1165 (2005)
Extraction of Sample Phase Content Red blood cells (RBCs): - optically homogeneous High-pass filtering Weak dependence of the fields on x Demodulation at q and low-pass filtering Kramers-Kronig relation Take the ratio of Im[z(x)] and Re[z(x)]
Red Blood Cells (RBCs) • Why interested in RBCs? • Membrane integrity → Cell shape • Shape • → Indicator of health • → Pathology (sickle cell disease, alcoholism, etc) • Simple, flexible, dynamic • Membrane mechanics and fluctuations not well understood
Apparatus of Phase-Locked Quantitative Phase Microscope • Amplitude grating as a high-pass filter to extract only the component of the light that matches the fringe frequency • Dither locking with a PZT in Reference Arm helps investigate cellar activity at nm sensitivity • Long-term observation of cellar activity at a high speed is possible with a high speed CCD camera G. Popescu, T. Ikeda, K. Goda, C. A. Best, M. Laposata, S. Manley, R. R. Dasari, K. Badizadegan, and M. S. Feld, Phys. Rev. Lett., 97, 218101 (2006)
RBC Fluctuations 170 frames at 10.3ms/ frame Normal Cell
RBC Fluctuations 170 frames at 10.3ms/ frame Echinocyte • Echinocyte = crenated red blood cell
a b c d s e v d Analysis of Surface Tension s - spherocytes e - echinocytes d - discocytes v - vesicles • Tension increases from discocyte to spherosyte • Measurement of surface tension can be used as a medical diagnostic tool G. Popescu, T. Ikeda, K. Goda, C. A. Best, M. Laposata, S. Manley, R. R. Dasari, K. Badizadegan, and M. S. Feld, Phys. Rev. Lett., 97, 218101 (2006)
How LIGO Technology Can Be Applied to Biomedical Optics • Increase detector sensitivity • By Noise Reduction • By Feedback Control • By inventing a new low-noise configuration • Another Example (Detection of Neuron Swelling) • Neuron axons swell during the propagation of action potential. [I. Tasaki et al., Science, 210, 338 (1980)] • Neuron axons become birefringent during the propagation of action potential. Displacement Voltage C. Fang-Yen, M. C. Chu, H. S. Seung, R. R. Dasari, and M. S. Feld, Opt. Lett., 29, 2028 (2004) Time