Download
1 / 31
310 likes | 493 Views
Data-Based Decision Making Using student data-because it’s best practice & it’s required. Dr. David D. Hampton Bowling Green State University. Today. Discuss the pressing need for compiling and USING student progress data to drive instruction Overview on types of assessment

E N D
Data-Based Decision MakingUsing student data-because it’s best practice & it’s required Dr. David D. Hampton Bowling Green State University
Today • Discuss the pressing need for compiling and USING student progress data to drive instruction • Overview on types of assessment • Provide an example of a research validated system of screening and progress monitoring • Questions & Discussion
Why Collect Data… “If we don't change direction soon, we'll end up where we're going.” Professor Irwin Corey
Why should we compile student outcome data? • It’s BEST PRACTICE! • Research is clear that understanding students’ response to instructional delivery, increases achievement. • those teachers who use student progress data to inform instruction have students who achieve higher scores on State-wide assessments • It is now required as part of OTES
Just a VERY brief word on Ohio Teacher Evaluation System • 50% of each teacher’s annual evaluation will be based upon the student progress in subject proficiency during an academic year. • The Benchmark for assessing this progress is called Student Learning Outcomes
What is a Student Learning Objective? • A Student Learning Objective (SLO) is a measurable, long-term academic growth target that a teacher sets at the beginning of the year for all students or for subgroups of students. SLOs demonstrate a teacher’s impact on student learning within a given interval of instruction based upon baseline data gathered at the beginning of the course.
High‐quality SLOs include the following: • Baseline and Trend Data. • Student Population. • Interval of Instruction. • Standards and Content. • Assessment(s). • Rationale for Growth Target(s).
5 Generic Data Reflection Questions • What do the data seem to tell us? • What don’t the data tell us? • What else might we want to know? • What good news is here for us to celebrate? • What opportunities for improvement are suggested by these data?
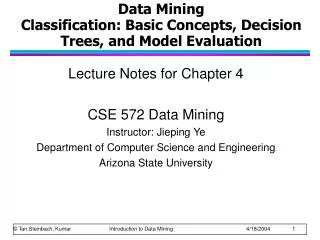
What Is the Difference Between Traditional Assessments and Progress Monitoring? • Traditional Assessments: • Lengthy tests • Not administered on a regular basis • Teachers do not receive immediate feedback • Student scores are based on national scores and averages and a teacher’s classroom may differ tremendously from the national student sample
What Is the Difference Between Traditional Assessments and Progress Monitoring? • Curriculum-Based Measurement (CBM) is one type of PM • CBM provides an easy and quick method for demonstrating student progress • Teachers can analyze student scores and adjust student goals and instructional programs • Student data can be compared to teacher’s classroom or school district data
Curriculum-Based Measurement A simple set of procedures for repeated measurement of student growth toward long-range instructional goals (Deno, 1985) Simple Repeated measurement Growth over time
Curriculum-Based Measurement • The result of 40 years of research • Used across the country • Demonstrates strong reliability, validity, and instructional utility
Curriculum-Based Measurement • Not interested in making kids read faster • Interested in kids becoming better readers • The CBM score is an OVERALL INDICATOR of reading competence • Students who score high on CBMs are better: • Decoders • At sight vocabulary • Comprehenders • Correlates highly with high-stakes tests
CBM: An Index of Academic Health Markell, M.
Weight Loss Graph Espin, C.
Interventions Espin, C.
How does weight loss relate to monitoring academic skills? • We want a graph of “educational health” • What do we measure? Espin, C.
Measuring Educational Health • We want to measure “educational health” using something that is: • Inexpensive • Easy • Time efficient • Sensitive to change • Easy to understand • An INDICATOR of educational health • The measures do tell us if our teaching is effective. The measures do not tell us what to teach. Espin, C.
The Basics of CBM in Reading • CBM monitors student progress throughout the school year • Students are given reading probes at regular intervals • Weekly, bi-weekly, monthly, FWS • Teachers use student data to quantify short- and long-term goals that will meet end-of-year goals
Goal Setting: Methods • Universal benchmarks, aggregate norms from a web-based system • Use of growth rates that reflect typical increases in performance by grade level
Oral Reading Fluency Norms, 2005 Grade WPM *Spring norms *Over 100,000 students Taken from: Oral Reading Fluency, 90 Years of Measurement. Behavioral Research and Teaching, Eugene, OR, 2005. http://brt.uoregon.edu/techreports/TR_33_NCORF_DescStats.pdf
GradeRealisticAmbitious 1 2.0 3.0 2 1.5 2.0 3 1.0 1.5 4 0.85 1.1 5 0.5 0.8 6 0.3 0.65 Maze Fluency 0.4 0.85 (see L. S. Fuchs, Fuchs, Hamlett, Walz, & Germann, 1993) Realistic and Ambitious Growth Rates for Oral Reading Fluency
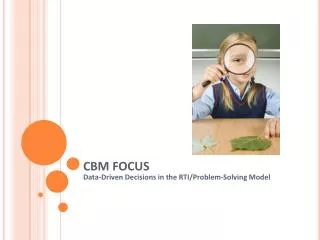
Data Utilization Now that I have all the data, what do I do?
Data Utilization—Most important aspect of CBM! • Is the student progressing? • Do I need to change instruction? • Is the instruction effective? • Is the instructional change effective? • Should I raise the student’s goal?
Intervention Implementation • Most important aspect of CBM USE THE DATA!!! • The following instructional elements may be altered to enhance student performance: • Instructional strategies • Size of instructional group • Time allocated for instruction • Materials used • Reinforcement
Thank you for your time • Questions & Comments • Please feel to contact me with any questions • David Hampton- BGSU • hamptod@bgsu.edu