Download
1 / 16
170 likes | 710 Views
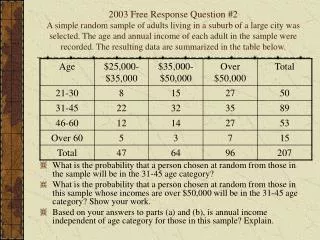
Ranked Set Sampling: Improving Estimates from a Stratified Simple Random Sample. Christopher Sroka, Elizabeth Stasny, and Douglas Wolfe Department of Statistics The Ohio State University. Alternative Title – Ranked Set Sampling: Where are the Samplers?.

E N D
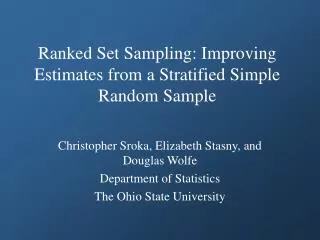
Ranked Set Sampling: Improving Estimates from a Stratified Simple Random Sample Christopher Sroka, Elizabeth Stasny, and Douglas Wolfe Department of Statistics The Ohio State University
Alternative Title – Ranked Set Sampling: Where are the Samplers? • Purpose: Show that RSS can be incorporated into traditional sampling designs • Compare RSS to traditional sampling designs • Develop stratified ranked set sampling (SRSS) • Computer simulation to evaluate relative standard error
Notation • Select m random samples of size m with replacement from the population • Order the m items within each set using auxiliary variable or visual judgment • We do this before measuring our variable of interest
Notation • Select one ranked unit from each set and quantify with respect to variable of interest X[1]1 X[1]2 X[1]3 . . . X[1]m X[2]1 X[2]3 X[2]2 X[2]m X[3]m X[3]1 X[3]3 X[3]2 . . . . . . . . . . . . X[m]m X[m]1 X[m]3 X[m]2 Set m Set 1 Set 3 Set 2
. . . X[1]k X[2]k X[3]k . . . X[m]k Notation • Repeat k times to get a total of mk measurements on our variable of interest X[1]1 X[2]1 X[3]1 . . . X[m]1 X[1]2 X[2]2 X[3]2 . . . X[m]2
Notation • Our estimator of the population mean for the variable of interest is the average of our mk quantified observations:
RSS vs. Stratified Sampling • For fixed sample size n = mk,
RSS estimator from before Stratum weights RSS vs. Stratified Sampling • Expect SSRS to be better than RSS, since uses more population info • Can we improve on SSRS using RSS? • Stratified ranked set sampling (SRSS): Use RSS to select units from each stratum • We estimate the population mean by
Simulation • USDA data on corn production in Ohio • Treat the data set as a population • Use computer simulation to estimate the precision of each technique • Sample from data using each method • Estimate mean accordingly • Repeat 50,000 times • Use the variance of the 50,000 mean estimates to approximate the standard error of the estimator
Simulation • Performed simulation multiple times, varying • Sample size • Number of strata • Number of sets • Combination of ranking variable and variable of interest (correlations vary) • Reported standard error as percent of standard error under simple random sampling
Simulation • Number of sets in RSS equals number of strata in SSRS and SRSS • Only one cycle within strata for SRSS • For example, for 3 strata and sample size of 30 RSS: 3 sets of 3, repeat for 10 cycles SSRS: 3 strata, 10 observations per stratum SRSS: 3 strata, 10 sets of 10, 1 obs. per set
Results • SRSS is more precise than SSRS for almost all combinations of variables, set sizes, and sample sizes • Increased precision of SRSS the highest when • Strong correlation between ranking variable and variable of interest (i.e., accurate rankings) • Large sample size • SRSS less precise or not much more precise than SSRS when • Low correlation • Large number of strata combined with low sample size
Results – High Correlation (0.996) WHITE = SSRS RED = SRSS
Results – Moderate Correlation (0.620) WHITE = SSRS RED = SRSS
Conclusions • Can improve precision of survey estimation by using RSS in place of SRS • SRSS will improve estimation for all variables in a survey, no matter how low the correlation • SRSS may not require collecting additional information
Future Research • Use different variables for stratification and ranking • Performance under optimal strata allocation • Do results hold for any sampling design that uses SRS in its final stage? • Cost considerations