Download
1 / 21
210 likes | 404 Views
Lecture 10 Open-Economy. Open and Closed Economies. A closed economy is one that does not interact with other economies in the world. There are no exports, no imports, and no capital flows. An open economy is one that interacts freely with other economies around the world.

E N D
Open and Closed Economies • A closed economy is one that does not interact with other economies in the world. • There are no exports, no imports, and no capital flows. • An open economy is one that interacts freely with other economies around the world. • An Open Economy • An open economy interacts with other countries in two ways. • It buys and sells goods and services in world product markets. • It buys and sells capital assets in world financial markets.
Trade Balance • Exports are goods and services that are produced domestically and sold abroad. • Imports are goods and services that are produced abroad and sold domestically. • Net exports (NX) are the value of a nation’s exports minus the value of its imports. • Net exports are also called the trade balance. • A trade deficit is a situation in which net exports (NX) are negative. • Imports > Exports • A trade surplus is a situation in which net exports (NX) are positive. • Exports > Imports • Balanced trade refers to when net exports are zero—exports and imports are exactly equal.
The Flow of Financial Resources:Net Capital Outflow Net capital outflow refers to the difference between the purchase of foreign assets by domestic residents and the purchase of domestic assets by foreigners. Net capital outflow = Purchase of foreign assets by domestic residents – Purchase of domestic assets by foreigners. Example: When a U.S. resident buys stock in Telmex, the Mexican telecommunications company, the purchase increases the first term on the right side of this equation and, therefore, increases U.S. net capital outflow. When a Japanese resident buys a bond issued by the U.S. government, the purchase increases the second term on the right side of this equation and, therefore, decreases U.S. net capital outflow. The flow of capital between the U.S. economy and the rest of the world takes two forms. If McDonald’s opens up a fast-food outlet in Russia, that is an example of foreign direct investment. Alternatively, if an American buys stock in a Russian corporation, that is an example of foreign portfolio investment. In the first case, the American owner (McDonald’s Corporation) actively manages the investment, whereas in the second case, the American owner (the stockholder) has a more passive role. In both cases, U.S. residents are buying assets located in another country, so both purchases increase U.S. net capital outflow. The net capital outflow (sometimes called net foreign investment) can be either positive or negative. When it is positive, domestic residents are buying more foreign assets than foreigners are buying domestic assets. Capital is said to be flowing out of the country. When the net capital outflow is negative, domestic residents are buying less foreign assets than foreigners are buying domestic assets. Capital is said to be flowing into the country. That is, when net capital outflow is negative, a country is experiencing a capital inflow.
The Equality of Net Exports and Net Capital Outflow We have seen that an open economy interacts with the rest of the world in two ways—in world markets for goods and services and in world financial markets. Net exports and net capital outflow each measure a type of imbalance in these markets. Net exports measure an imbalance between a country’s exports and its imports. Net capital outflow measures an imbalance between the amount of foreign assets bought by domestic residents and the amount of domestic assets bought by foreigners. An important but subtle fact of accounting states that, for an economy as a whole, net capital outflow (NCO) must always equal net exports (NX): NCO = NX. This equation holds because every transaction that affects one side of this equation affects the other side by exactly the same amount. This equation is an identity— an equation that must hold because of the way the variables in the equation are defined and measured. To see why this accounting identity is true, let’s consider an example. Imagine that you are a computer programmer residing in the United States. One day, you write some software and sell it to a Japanese consumer for 10,000 yen. The sale of software is an export of the United States, so it increases U.S. net exports. What else happens to ensure that this identity holds? The answer depends on what you do with the 10,000 yen you are paid. First, let’s suppose that you simply stuff the yen in your mattress. (We might say you have a yen for yen.) In this case, you are using some of your income to invest in the Japanese economy. That is, a domestic resident (you) has acquired a foreign asset (the Japanese currency). The increase in U.S. net exports is matched by an increase in the U.S. net capital outflow. More realistically, however, if you want to invest in the Japanese economy, you won’t do so by holding on to Japanese currency. More likely, you would use the 10,000 yen to buy stock in a Japanese corporation, or you might buy a Japanese government bond. Yet the result of your decision is much the same: A domestic resident ends up acquiring a foreign asset. The increase in U.S. net capital outflow (the purchase of the Japanese stock or bond) exactly equals the increase in U.S. net exports (the sale of software). Let’s now change the example. Suppose that instead of using the 10,000 yen to buy a Japanese asset, you use it to buy a good made in Japan, such as a Toyota car. As a result of the Toyota purchase, U.S. imports increase. The software export and the Toyota import represent balanced trade. Because exports and imports increase by the same amount, net exports are unchanged. In this case, no American ends up acquiring a foreign asset and no foreigner ends up acquiring a U.S. asset, so there is also no impact on U.S. net capital outflow.
When a nation is running a trade surplus (NX > 0), it is selling more goods and services to foreigners than it is buying from them. What is it doing with the foreign currency it receives from the net sale of goods and services abroad? It must be using it to buy foreign assets. Capital is flowing out of the country (NCO > 0). • When a nation is running a trade deficit (NX < 0), it is buying more goods and services from foreigners than it is selling to them. How is it financing the net purchase of these goods and services in world markets? It must be selling assets abroad. Capital is flowing into the country (NCO < 0). The international flow of goods and services and the international flow of capital are two sides of the same coin.
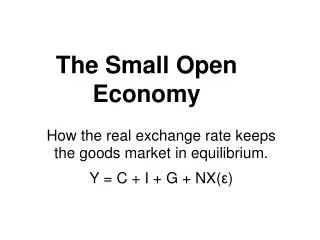
Saving, Investment, and Their Relationshipto the International Flows A nation’s saving and investment are crucial to its long-run economic growth. As we have seen earlier, saving and investment are equal in a closed economy. But matters are not as simple in an open economy. Let’s now consider how saving and investment are related to the international flows of goods and capital as measured by net exports and net capital outflow. The economy’s gross domestic product (Y) is divided among four components: consumption (C), investment (I), government purchases (G), and net exports (NX). We write this as Y = C + I + G + NX. Total expenditure on the economy’s output of goods and services is the sum of expenditure on consumption, investment, government purchases, and net exports. Because each dollar of expenditure is placed into one of these four components, this equation is an accounting identity: It must be true because of the way the variables are defined and measured.
National saving is the income of the nation that is left after paying for current consumption and government purchases. National saving (S) equals Y – C – G. That means S= Y – C – G Now we know Y = C + I + G + NX If we rearrange the equation, we obtain Y – C – G = I + NX S = I + NX. ( because S= Y – C – G) We also know net exports (NX) also equal net capital outflow (NCO), that is NCO=NX So S = I + NCO This equation shows that a nation’s saving must equal its domestic investment plus its net capital outflow. In other words, when U.S. citizens save a dollar of their income for the future, that dollar can be used to finance accumulation of domestic capital or it can be used to finance the purchase of capital abroad. This equation should look somewhat familiar. When we analyzed the role of the financial system, we considered this identity for the special case of a closed economy. In a closed economy, net capital outflow is zero (NCO = 0), so saving equals investment (S = I). By contrast, an open economy has two uses for its saving: domestic investment and net capital outflow.
Foreign Exchange Rate • An exchange rate between two currencies is the rate at which one currency will be exchanged for another. It is also regarded as the value of one country’s currency in terms of another currency.For example, if the exchange rate of taka in terms of US dollar is 80 taka then it implies that $1 is equivalent to 80 taka or we need 80 taka to buy $1. • In the retail currency exchange market, a different buying rate and selling rate will be quoted by money dealers. The buying rate is the rate at which money dealers will buy foreign currency, and the selling rate is the rate at which they will sell the currency.
Determination of Exchange Rate • The exchange rate between domestic currency and foreign currency is determined by the supply and demand of foreign currency. In the figure we have the demand curve and supply curve of dollar ( in X axis we have the quantity of dollar and in Y axis we have the price of dollar in terms of taka that means how much 1 dollar is worth off). From the figure we can see that the equilibrium price of dollar in terms of taka is $1= 80 tk. and the total amount of dollar in the economy is $20 billion.
Nominal Exchange Rate • The nominal exchange rate is the rate at which a person can trade the currency of one country for the currency of another. • The nominal exchange rate is expressed in two ways: • In units of foreign currency per one U.S. dollar. • And in units of U.S. dollars per one unit of the foreign currency. • Assume the exchange rate between the Japanese yen and U.S. dollar is 80 yen to one dollar. • One U.S. dollar trades for 80 yen. • One yen trades for 1/80 (= 0.0125) of a dollar.
Demand and Supply Curve of Currency • Why does demand curve of dollar slopes downward? Explanation: The demand curve of foreign currency like US dollar shows how demand of dollar changes with the price of dollar. The demand curve of dollar is downward sloping because if the price of dollar falls then people will demand more dollar. The main demand of dollar comes from the importers. • Why does supply curve of dollar slopes upward? Explanation: The supply curve of dollar shows how the supply of dollar changes with the price of dollar. The supply curve of dollar is upward sloping because if the price of dollar increases then people will increase the supply of dollar. For Bangladesh main suppliers of dollar are exporters and migrants.
Depreciation of Local Currency • Depreciation of local currency implies that there is a fall in value of the local currency in terms of foreign currency. If taka is depreciated against dollar then this implies that the value of taka is decreased. For example: Suppose the exchange rate of taka in terms of dollar was $1=80 taka. Now there is a depreciation of taka and the new exchange rate is $1=85 taka. So we need more taka to buy same amount of dollar as before. • How there can an depreciation of a local currency : If there is an increase in demand of dollar then there will a depreciation of taka
Appreciation of Local Currency • Appreciation of local currency implies that there is an increase in value of the local currency in terms of foreign currency. If taka is appreciated against dollar then this implies that the value of taka has increased. For example: Suppose the exchange rate of taka against dollar was $1=80 taka. Now there is an appreciation of taka and the new exchange rate is $1=75 taka. So we need less taka to buy same amount of dollar as before which implies that the value of taka has increased ( appreciated) • How there can an appreciation of a local currency : If there is an increase in supply of dollar then there will an appreciation of taka
Real Exchange Rates • The real exchange rate is the rate at which a person can trade the goods and services of one country for the goods and services of another. • The real exchange rate compares the prices of domestic goods and foreign goods in the domestic economy. • If a case of German beer is twice as expensive as American beer, the real exchange rate is 1/2 case of German beer per case of American beer. • The real exchange rate depends on the nominal exchange rate and the prices of goods in the two countries measured in local currencies. • The real exchange rate is a key determinant of how much a country exports and imports. • A depreciation (fall) in the U.S. real exchange rate means that U.S. goods have become cheaper relative to foreign goods. • This encourages consumers both at home and abroad to buy more U.S. goods and fewer goods from other countries. • As a result, U.S. exports rise, and U.S. imports fall, and both of these changes raise U.S. net exports. • Conversely, an appreciation in the U.S. real exchange rate means that U.S. goods have become more expensive compared to foreign goods, so U.S. net exports fall.
Example of Real Exchange Rate Real and nominal exchange rates are closely related. To see how, consider an example. Suppose that a bushel of American rice sells for $100, and a bushel of Japanese rice sells for 16,000 yen. What is the real exchange rate between American and Japanese rice? To answer this question, we must first use the nominal exchange rate to convert the prices into a common currency. If the nominal exchange rate is 80 yen per dollar, then a price for American rice of $100 per bushel is equivalent to 8,000 yen per bushel. American rice is half as expensive as Japanese rice. The real exchange rate is ½ bushel of Japanese rice per bushel of American rice. We can summarize this calculation for the real exchange rate with the following formula: Using the numbers in our example, the formula applies as follows: Real exchange rate = (80 yen/dollar) × ($100/bushel of American rice) 16,000 yen/bushel of Japanese rice = (8000 yen/bushel of American rice) 16,000 yen/bushel of Japanese rice = ½ bushel of Japanese rice/bushel of American rice.
Different Exchange Rate Regime • There mainly three types of exchange rate regime: 1) Floating/Flexible Exchange Rate Regime 2) Fixed Exchange Rate Regime 3) Managed Float Regime
Floating Exchange Rate Regime • In this regime exchange rate is determined in the market that means by the supply and demand of foreign currency. Govt has no influence ( that means govt. don’t intervene ) in the foreign exchange market. • Exchange rate is determined by the intersection of demand and supply of foreign currency.
Fixed Exchange Rate Regime • In this regime exchange rate is determined by the govt. not by the market demand and supply. So govt. fixes a rate at which the foreign currency will be transacted. For example: the govt. can fix the exchange rate at $1= 85 taka which is higher than the equilibrium exchange rate $1= 80 taka ( determined by the market). Or the govt. can fix the exchange rate at $1=75 taka which is lower than the equilibrium exchange rate. • If the govt. fixes the exchange rate higher than equilibrium exchange rate then there will be an excess supply of dollar. • If the govt. fixes the exchange rate lower than equilibrium exchange rate then there will be an excess demand of dollar.
Govt. can influence the foreign exchange market by devaluation and revaluation Devaluation: The govt. can reduce the value ( devalue ) of the local currency so that a unit of the domestic currency can buy fewer units of foreign currencies than before. For example: in the previous graph it will be a situation like $1= 85 taka set by the govt. Revaluation: The govt. can increase the value of the local currency so that a unit of the domestic currency can buy more units of foreign currencies than before. For example: when the govt. sets the exchange rate $1= 75 taka, it is actually increasing the value of taka that means revaluating.
Managed Floating Exchange Rate Regime: It is in between flexible and floating exchange rate regime. Here the exchange rate is determined by the market demand and supply but govt. has some control over the market that means govt. will intervene the market if there is a high fluctuation in the exchange rate. In this system govt. determines a range of values of foreign exchange rate and do not intervene in the market if the exchange rate is within this range. But it will intervene the market by changing the supply of foreign currency if the exchange rate lies outside the range. For example: suppose the govt. has decided the maximum value of exchange rate of US dollar will be $1=85 tk and minimum is $1= 75 tk. So the range of exchange rate is $1=75 tk to 85 tk. If the exchange rate falls below $1=75 tk then central bank will decrease the supply of US dollar ( so that the price of dollar rises above 75 tk) . On the other hand if the exchange rate rises above $1=85 tk then central bank will increase the supply of US dollar ( so that the price of dollar falls below 85 tk)