Download

1 / 18
180 likes | 302 Views
Factors Influencing Student Usage of Supplemental Instruction and Grade Achievement. Eric Rabitoy Ed.D. Candidate California State University, Fullerton. Topic Background. Supplemental Instruction (SI) Initiated by Deanna Martin at the University of Missouri, Kansas City (Martin, 1980)

E N D
Factors Influencing Student Usage of Supplemental Instruction and Grade Achievement Eric Rabitoy Ed.D. Candidate California State University, Fullerton
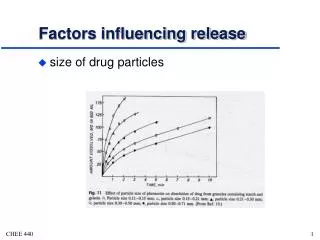
Topic Background • Supplemental Instruction (SI) • Initiated by Deanna Martin at the University of Missouri, Kansas City (Martin, 1980) • Provides support for students enrolled in high-risk courses • Intent of SI
Topic Background • SI Pedagogy • Relies on regular out-of-class group interactions focused on integrating reasoning and study skills (Arendale, 2004; Van Lanen & Lockie, 1997)
Topic Background • SI Pedagogy • Open to all enrolled students • Students work with the SI leader in small groups to discuss course content and learn to integrate effective skills (Arendale, 1994; Congos, 2002) • Participating students take an active role
Impact of SI • Studies suggest that students participating in SI benefit in a number of ways over non-participants: • final course grades (Commander, Stratton, Callahan & Smith, 1996; Fayowski & McMillan, 2008; Moore & LeDee, 2006) • cumulative GPA (Fayowski & McMillan, 2008) • graduation rates (Arendale, 1998; Bowles, McCoy & Bates, 2008)
SI Environment • Student populations are diverse • Ethnicity, academic preparation, gender • SI environment is diverse • # SI sessions attended, gender/ethnicity of SI leader, gender/ethnicity of course instructor • Each of these variables may have an impact on final course grade and cumulative GPA
Research Study • This study evaluated the effect of these multiple independent variables on one another, as well as on final course grade and cumulative GPA, for community college students enrolled in math and science courses
Theoretical Framework • Input – Environment – Outcome College Impact Model (Astin, 1993) • Input – characteristics students possess upon entrance to college • Environment – programs, people, and cultures that students experience as a result of their participation in college • Outcome – skills, knowledge, values, and beliefs that students obtain as a result of their college experience.
Data Collection • Data originated with student and faculty participation in an SI program in STEM-related disciplines at a single community college campus district in Southern California • Spring 2009, fall 2009, winter 2010, and spring 2010 semesters (N = 3,443)
Research Design: Data Analysis • Data analysis relied upon a multivariate path analytic approach (AMOS) • account for the simultaneous influence of multiple variables acting together within a model (Ewert & Sibthorp, 2000) • determine the influence of individual variables on overall effect (Graham, 2007)
Research Design: Data Analysis • Structural Equation Modeling (SEM) enables researchers to develop, estimate, and evaluate complex multivariate models and study both direct and indirect effects associated with variables • Causal relationships between variables are depicted with arrows; indicating the influence of one variable on another (Ewert & Sibthorp, 2000) • The resulting diagram consists of a series of paths that indicate the effect of one variable on another within a model (Raykov & Marcoulides, 2006)
Results – General Model Large Effect Size* Medium Effect Size* Small Effect Size* * (Cohen, 1988) X2 = 1,715.74, df = 31, N = 3,443 p < .001
Results - Gender Females Males X2 = 983.759, df = 25, N = 1,956, p < .001 X2 = 634.437, df = 28, N = 1,424, p < .001
Results – SOC Status SOC White students X2 = 740.848, df = 26, N = 1,659, p < .001 X2 = 385.860, df = 8, N = 768, p < .001
References Arendale, D. (1994). Understanding the supplemental instruction model. In D. C. Martin, & D. R. Arendale (Eds.), Supplemental instruction: Increasing achievement and retention. New Directions for Teaching and Learning, (60), 11-21. San Francisco: Jossey-Bass. Arendale, D. (1998). Increasing efficiency and effectiveness of learning for freshmen students through Supplemental Instruction. In P. Dwinell, & J. S. Higbee (Eds.). The role of developmental education in preparing successful college students. Columbia, SC.: The National Association for Developmental Education and the National Center for the Study of the First Year Experience and Students in Transition. Arendale, D. (2004). Pathways of persistence: A review of postsecondary peer cooperative learning programs. In I. M. Duranczyk, J. L. Higbee, & D. B. Lundell (Eds.), Best practices for access and retention in higher education. (pp. 27-40). Minneapolis, MN: Center for Research on Developmental Education and Urban Literacy, General College, University of Minnesota. Astin, A. W. (1993). What matters in college? Four critical years revisited. San Franscisco: Jossey-Bass.
References Bowles, T., McCoy, A., & Bates, S. (2008). The effect of Supplemental Instruction on timely graduation. College Student Journal, 42(3), 853-859. Cohen, J. (1980). Statistical power and analysis for the behavioral sciences (2nd ed.). Hillsdale, NJ: Lawrence Erlbaum Associates. Commander, N. F., Stratton, C. B., Callahan, C. A., & Smith, B. D. (1996). A learning assistance model for expanding academic support. Journal of Developmental Education. 20(2), 8-16. Congos, D. (2002). How supplemental instruction stacks up against Chickering’s 7 principles for good practice in undergraduate education. Research & Teaching in Developmental Education, 19(1), 75-83. Ewert, A., & Sibthorp, J. (2000). Multivariate analysis in experiential education: Exploring the possibilities. The Journal of Experiential Education, 23(2), 108-117.
References Fayowski, V., & MacMillan, P. (2008). An evaluation of the Supplemental Instruction programme in a first year calculus course. International Journal of Mathematical Education in Science & Technology, 39(7), 843-855. Graham, J. (2007). The general linear model as structural equation modeling. Journal of Educational and Behavioral Statistics, 33(4), 485-506. Martin, D. C. (1980). Learning centers in professional schools. In K. V. Lauridsen Ed.), New directions for college learning assistance: Examining the scope of learning centers (pp. 69-79). San Francisco: Jossey-Bass. Moore, R., & LeDee, O. (2006). Supplemental Instruction and the performance of developmental education students in an introductory biology course. Journal of College Reading and Learning, 38(2), 9-20. Raykov, T., & Marcoulides, G. (2006). A first course in structural equation modeling (2nd ed.). New York: Psychology Press. Van Lanen, R. J., & Lockie, N. (1997). Using Supplemental Instruction to assist nursing students in chemistry. Journal of College Science Teaching, 26(6), 419-423.