Download
1 / 46
470 likes | 626 Views
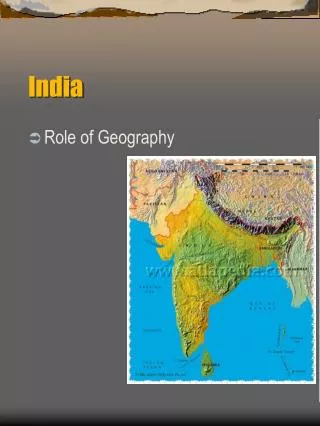
AGRICULTURAL MARKETING INFRASTRUCTURAL FACILITIES IN INDIA – STATE WISE ANALYSIS Dr. M. S. Jairath, National Institute of Agricultural Marketing Ministry of Agriculture, Govt. of India Jaipur. MARKETING INFRASTRUCTURE. All Facilities Needed for Smooth Conduct of Marketing

E N D
AGRICULTURAL MARKETING INFRASTRUCTURAL FACILITIES IN INDIA – STATE WISE ANALYSIS Dr. M. S. Jairath, National Institute of Agricultural Marketing Ministry of Agriculture, Govt. of India Jaipur
MARKETING INFRASTRUCTURE • All Facilities Needed for Smooth Conduct of Marketing • Transfer of appropriate Price Signals leading to improved marketing efficiency • Role of infrastructure is the key element of any development programme yet their role in distribution and marketing is the supreme. • Infrastructure (a) Hard and (b) Soft
OBJECTIVES OF THE STUDY • To examine the status of different agricultural marketing infrastructures, • Their geographical spread in the different states of India and • Also to obtain expert opinion of policy makers/ experts in agricultural marketing for strengthening of these infrastructural facilities.
METHODOLOGY • The information on agricultural marketing infrastructures has been gathered from • Annual report of various ministries & their directorate dealing in the subject i.e. • Directorate of Marketing & Inspection, • National Horticulture Board, • Ministry of Transport, Directorate of Surface Transport, • Department of Telecommunication, Ministry of Communication, • Ministry of Food & Civil Supply, • Published reports and websites of the Ministries.
Agri-Markets in India as on 31.03.2010 • No of Regulated Wholesale Markets - 7157 • No of Rural Primary Markets -- 21,221 (about 15% are regulated markets) Total – 28378
AGRICULTURAL PRODUCE MARKETS • 7157 regulated markets in the country - March 2010. • Average area served per market varied among the states of India. 103 Sq.Km in Punjab, 129 in West Bengal, 156 in Haryana, 305 in Andhra Pradesh, 347 in Assam, 350 in Mahrashtra, 383 in Karnataka and 394 in Uttar Pradesh. • The states like Arunachal Pradesh, Himachal Pradesh, Meghalyaya, Sikkim, and Uttaranachal where average area served by each market was more than one thousand sq.km.
Specialized Markets • The share of specialized markets like fruits and vegetables in total regulated markets is low. • Only few states have separate Fruit and Vegetables wholesale regulated markets. • Their availability is not even one per thousand-sq. km. Area. • Even the horticulture States which accounts for nearly 20 per cent of fruits and vegetables production does not have even one regulated market per 00’ sq. km area.
DIRECT MARKETING • Apni Mandi ( Punjab), Rythu Bazar ( Andhra Pradesh), Uzahaver Shandies (T.N.) and Shetkoori bazars in Maharashtra. But promoted only at the State headquarter and some district headquarters adjoining to the state. • After Reforms License for Direct Marketing has been granted in Maharashtra to M/S Aditya Birla Retail Ltd, Ruchi Soya Industries, M/s Tina Oils, etc & in Gujarat to Borsad Agro Marketing Pvt. Ltd., Reliance Agri Products Distribution Pvt. Ltd., Reliance Fresh, etc. In Madhya Pradesh and Rajasthan to ITC e-choupal. In Uttar Pradesh to Haryali Kisan Bazar
Electronic Spot Exchange • license granted to National Spot Exchange Ltd. (NSEL), NCDEX Spot Exchange Ltd. (NSPOT) and National Agriculture Produce Marketing Company of India Ltd. (NAPMC). • Today their availability in states of Maharashtra, Karnataka, Gujarat, Rajasthan, Bihar, Orissa and Madhya Pradesh for trading commodities e.g. cotton, caster seeds, maize, deshi chana, guar, betel nut, etc.
Contract Farming • License for Contract Farming to more than 65 companies in 14 states Karnataka, Maharashtra, M.P. Punjab, Tamil Nadu, Chhattisgarh, Uttaranchal, Haryana, A.P. Gujarat, Orissa, Sikkim, Kerala and West Bengal. • License for more than 42 crops and medicinal plants have been extended to these companies.
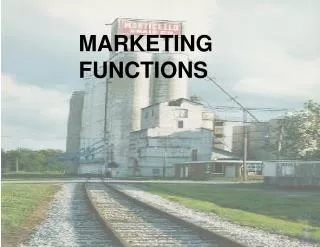
STORAGE INFRASTRUCTURE • The total storage capacity available at the end of 2010 of CWC, SWC, and FCI is about 75 million tonnes. About 25 million tones of grains are stored in the form of CAP (covered & plinth). • The Rural Godowns under NCRG Scheme initiated in 1979 have constructed rural godowns of 15 million tonnes.capacity. • Under the Gramen Bhandaran Yojana of GOI, about 67 M.T. capacities have been created in the country up to March 2010.
STORAGE INFRASTRUCTURE • No. of Godown 000 Sq.Km of area in India not even One (0.79) • States like Haryana, Kerala, Nagaland, Punjab, Bihar, and West Bengal have availability of about 2 to 5. • Concerted efforts required to promote more godowns in the states of Jharkhand, Orissa, Gujarat, H.P. Uttarakhand and NE States (except Nagaland)
STORAGE INFRASTRUCTURE • Based on storage capacity available per 000 tones of produce Punjab, Haryana, Andhra Pradesh, Kerala, M.P. are better of states compared to all India average. • All other states needs to put lot of investment if they want to provide space for storage to their producer - growers
Cold Storages • Presently only 5274 cold storages with a total capacity of 24.31 million tones. • Availability of cold storage 000 Sq.km of area is less than 2 • States better than average Punjab, U.P. Goa, Haryana, West Bengal,Kerala,Bihar, Gujarat. • Rajasthan,Mahrashtra, A.P. Jharkhand, Orissa, Hilly States, NE States, focused efforts
Cold Storages • Capacity available per 000 tones of produce found to be better than all India average in Punjab, Uttar Pradesh, West Bengal and Rajasthan • Reefer Vans/ Containers: Availability increased from 431 in 2001 to 3711 during 2010 But extremely low looking to the need for transportation of perishable commodities • Pre Cooling Arrangements: Initiative just begin. Required huge efforts
CLEANING AND GRADING • Common Trade language, also helps in collection and dissemination of accurate market information, cooperatively pooling of produce, adoption of group marketing system, and creating quality consciousness • Only 1321 grading centres • Quantity graded at producer’s level is still almost negligible. • There is a need to create facilities for cleaning, grading and packaging at primary level
Grading Laboratories • 956 laboratories for analysis of check / sample research and training of sponsored chemists. • Spread of laboratories per 000 Sq. Km not even one • 2 laboratories available to serve 000 tone of produce • Complete absent in NE states, Sikkim and Goa. • Availability is much below the all India average in the states of West Bengal, Andhra Pradesh, Bihar, Chhattisgarh, Gujarat, Jharkhand, Karnataka, Madhya Pradesh, Orissa, Punjab, Tamil Nadu and Uttaranchal.
MARKET INFORMATION SYSTEM • 3011agmarknet nodes are linked with National Information Network (NIC-NET) to provide the speedy and timely dissemination of information • Agmarknet nodes 000’ Sq. Km of area not even one. • Availability per 000’ tones of produce is six. • States of Assam, Bihar, Jharkhand, Manipur, West Bengal, Orissa, Punjab, Uttar Pradesh and Uttaranchal need to expand.
RISK MANAGEMENT & E – TRADING INFRASTRUCTURE • Wide fluctuations in prices largely due to monsoon and their seasonality. Farmers faces huge uncertainties. • forward, future and options are the risk management tools which can be used to avoid the impact of unexpected price changes in future price movements. • Forward and future contracts enable price discovery. The price discovery function allows important economic decisions to be made as to which commodity produce, how much to sell and what prices, how much to store and for how long.
RISK MANAGEMENT & E – TRADING INFRASTRUCTURE • At present 29 Commodity Exchanges. • Only 20 exchanges are effectively working • Future trading in agricultural commodities has also been allowed for 54 commodities. • Forward trading has been extended to 39 agricultural commodities only. • However the transaction undertaken through these exchanges so far has been minimal but experiencing a rising trend.
POST HARVEST TECHNOLOGY • Post-Harvest Technology Centers established for specific crops by ICAR has initiated the process for promotion of Post Harvest Technology in the form of providing of know-how on different aspects to the farmers and orchardists of the country. • State Agricultural Marketing Board and • Directorate of Horticulture • Their spread at the collection center or producer level is nearly non existence
MARKETING EDUCATION AND TRAINING • Need to provide market education and training to the farmer – producers, traders, marketing personnel, policy makers. • The Directorate of Marketing & Inspection, • State Agricultural Marketing Board, State Marketing Department, • Agricultural University and • National Institute of Agricultural Marketing • Promote more Institutes/Centers based on agro climatic zones
Cooperative Marketing Institutions • Primary, Central and State level Marketing Societies, Unions, and Federations. • Special Commodities Marketing Societies (Sugarcane, Cotton, Oilseeds, Milk etc.) • Processing Societies - Cotton Processing and Ginning Societies - Oilseeds Processing Societies - Fruits and Vegetables Preservation Societies - Sugarcane Crushing Societies - Milk Processing and Chilling Societies; etc. • National Agricultural Cooperative Marketing Federation (NAFED) • National Cooperative Development Corporation • Tribal Cooperative Marketing Federation (TRIFED)