Download
1 / 40
400 likes | 482 Views
User Centered Design September 10th, 2008. Agenda . 12:00-12:05 Introduction 12:05-12:15 Usability Engineering I 12:15-12:35 User Centred Design 12:35-12:45 Usability Engineering II 12:45-12:50 Resources 12:50-1:00 Q&A. Introduction. Usability Engineering I .

E N D
Agenda • 12:00-12:05 Introduction • 12:05-12:15 Usability Engineering I • 12:15-12:35 User Centred Design • 12:35-12:45 Usability Engineering II • 12:45-12:50 Resources • 12:50-1:00 Q&A
Usability Engineering I What is Usability Engineering? Concepts Research UNA Terminology Process and lifecycles Usability Engineering How it fits into the development lifecycle Benefits to the organization and project Cost analysis
Research User Profile… Tool Set… User Experience…*aggregate score
Benefits of Understanding User Increase success rate Reduce user error Increase productivity Increase user satisfaction Increase job satisfaction Increase ease of use Increase ease of learning Increase trust in systems Decrease support costs Reduce training costs
User Centred Design • What is UCD? • User Experience • Benefits • Process • Development Lifecycle • User Profiles • Personas • Storyboards & Wireframes • Prototypes • Style Guide
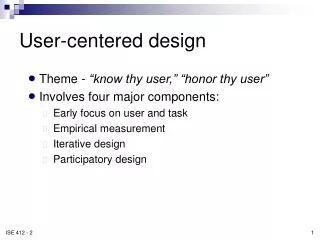
What is UCD? User-Centred Design is: A process Users engaged in the design process Users having real decision making powers Users having appropriate mechanism for communicating with, and negotiation with, the development team A socio-technical design process Containing iterative approach Where consideration is given to job satisfaction
What is UCD? Includes: User needs assessment & requirements Development of style guide Graphic, layout, information architecture, navigation model, interaction behaviour Prototyping and user testing (iterative) Assisting development & implementation Usability Testing
Benefits Reduced development time Reduces later changes, reducing cost of future design Increased efficiency, effectiveness, and satisfaction of usage Reduces task time Fewer user errors Less training and support documentation Reduced staff turnover Happier project team
User Profile A general description of a user group for a specific interface. Includes: Demographic characteristics Education Language Computer Expertise Domain Experience Motivation Expectations
Personas Personas – A concrete characterization of a single user group through a synthesis of user, task, and environment profiles of that group. Detailed example of the potential end-user that represents a specific target audience.
Storyboards Storyboard – Sketches or other visuals that help depict the design concept you have planned Iterative process Involvement of end-users User testing
Storyboards Storyboard – Sketches or other visuals that help depict the design concept you have planned Iterative process Involvement of end-users User testing
Style Guide Style Guide – set of rules that provide a reference for creating the look and feel of a design by clearly defining the conventions of each instance in the design. Iterative process – always being refined Graphic & page layout Font sizes Interactive behaviour
Heuristic Evaluation THE USER IS NOT RESPONSIBLE FOR: guessing what is happening, understanding unfamiliar terms, remaining within a mistaken workflow, interpreting inconsistent messages, working with error prone conditions, remembering information from one place to another, following novice procedures after a task is mastered, sorting through irrelevant information, judging the utility of an error message, or working on a task without any help
Effectiveness Efficiency Satisfaction ISO/IEC 25062:2006 “Common Industry Format (CIF) for usability test reports” Other metrics: Learnability Memorability Measuring Usability
Effectiveness Effectiveness relates the goals of using the product to the accuracy and completeness with which these goals can be achieved. Common measures of effectiveness include: Percent task completion Frequency of errors Frequency of assists
Efficiency Efficiency relates the level of effectiveness achieved to the quantity of resources expended. A common measure of efficiency is: Time on task
Satisfaction Satisfaction describes a user’s subjective response when using the product. Questionnaires to measure satisfaction and associated attitudes are commonly built using: Likert and semantic differential scales Using Proxies like Net Promoter
Net Promoter Score • How likely would the user be to recommend this system to a friend in the same situation? • Extremely Unlikely [ 0 1 2 3 4 5 6 7 8 9 10 ] Extremely Likely
How did satisfaction change? A Net Promoter Score > 0% implies a Net Migration of volume toward your product or services A Net Promoter Score < 0% Implies a Net Migration of volume away from your products or services Research in private industry has shown a long term economic affect associated with Net Promoter Scores Select NPS Stars Harley-Davidson 81% Costco 79% Amazon 73% Ebay 71% Apple 66% Intuit 58% Cisco 57% Federal Express 56% Southwest Airlines 51% American Express 50% Dell 50% Adobe 48% Electronic Arts 48% Satisfaction
Value Propositions • Reduce Development Costs • Increase Sales Revenue • Improve User Effectiveness • Marcus, Aaron (2002). Return on Investment for Usable User-Interface Design: Examples and Statistics. Aaron Marcus and Associates (AM+A)
How does efficiency translate to dollars? Improved task efficiency e.g. 5 minutes Standard Cost e.g. $50 / hour Task frequency e.g. 2 times / day Number of users e.g. 50 users Task period e.g. 250 work days / year Substituting real numbers Improved efficiency in hours = minutes / 60 minutes * Cost per hour * Task frequency * Number of users * Task period (5/60) * 50 * 2 * 50 * 250 = $104,167 / year Financial Relevance of Usability
Usability Engineering II What is Usability Engineering? Concepts Heuristic Evaluation Usability Testing Terminology Process and lifecycles Heuristic Evaluation Usability Testing How it fits into the development lifecycle Benefits to the organization and project Cost analysis
Resources Industry Standard Processes, Gurus, & Resources Usability BoK http://www.usabilitybok.org/about Certified Usability Analyst http://www.humanfactors.com/training/certification.asp Schaffer Method - Human Factors International (HFI) http://www.humanfactors.com/home/usability.asp Cooper http://www.cooper.com/ Rational Unified Process (RUP) + Creative Web Design Plug-in https://www.ibm.com/developerworks/rational/products/rup/ Usability Professionals’ Association (UPA) http://www.upassoc.org/