Download
1 / 1
10 likes | 95 Views
Study on interference effects in photoionization of H2, focusing on DPI via doubly excited states, showing quantum mechanical characteristics.

E N D
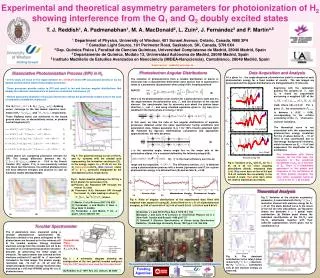
Experimental and theoretical asymmetry parameters for photoionization of H2 showing interference from the Q1 and Q2 doubly excited states T. J. Reddish1, A. Padmanabhan1, M. A. MacDonald2, L. Zuin2, J. Fernández3 and F. Martín4,5 1 Department of Physics, University of Windsor, 401 Sunset Avenue, Ontario, Canada, N9B 3P4 2 Canadian Light Source, 101 Perimeter Road, Saskatoon, SK, Canada, S7N 0X4 3 Dep. Química Física I, Facultad de Ciencias Químicas, Universidad Complutense de Madrid, 28040 Madrid, Spain 4 Departamento de Química, Modulo 13, Universidad Autónoma de Madrid, 28049 Madrid, Spain 5 Instituto Madrileño de Estudios Avanzados en Nanociencia (IMDEA-Nanociencia), Cantoblanco, 28049 Madrid, Spain Photoelectron Angular Distributions • The emission of photoelectrons from a random distribution of atoms or molecules has a characteristic differential cross section that is expressed in terms of a asymmetry () parameter when using 100% linearly polarised • light [5]: • (6) • Here is the photoionization cross section for a particular ionic state and is the angle between the polarisation axis, , and the direction of the ejected electron. Our spectrometer has its symmetry axis about the photon beam direction, ,not , and using standard equations given in [6], Eqn (6) is modified in the frame where z is along to be: • (7) • In this work, we take the ratio of two angular distributions of separate processes obtained under the same spectrometer tuning conditions and polarization state, Stokes parameter S1 (= 1 for 100% linearly polarized light) [8]. Followed by rigorous mathematical calculations and appropriate approximations, the ratio becomes: • (8) • is the azimuthal angle, whose origin lies on the major axis of the polarization ellipse. k is a constant defined by the following integral (9), • (9); is the mean efficiency over the • range and by inspection; .The efficiency function, , is obtained using a photoionization process with a known parameter and S1 for a given photoelectron energy. k is obtained from (9) and we take S1 = 0.98. Email contact : reddish@uwindsor.ca Data Acquisition and Analysis Dissociative Photoionization Process (DPI) in H2 At a given h, the angle-dispersed photoelectron yield is recorded at each photoelectron energy for a fixed number of counts . The raw images are processed and the angular distributions are histogrammed in 5º intervals. • In this study, we focus on the region between h = 31-35 eV where DPI can proceed directly or via the doubly excited neutral states that promptly autoionize. • These processes provide routes to DPI and result in ion and electron angular distributions that display the hallmark characteristics of quantum mechanical interference [1]. • What is particularly dramatic is that such interference effects are prominently evident even in the case of randomly orientated H2 molecules. Beginning with the calibration point(s), the variation of with Ek is found by sequentially performing a weighted LSF of the yield, where Ek = 0.2 eV. For a given , the uncertainty in is between ± (0.02 – 0.06), corresponding to the relative uncertainty of the ‘channel-to- channel’ variations. The theoretical curve is not convoluted with the experimental photoelectron energy resolution For the values below Ek ~ 10 eV there is also contribution due to low energy ‘background’ electrons, which increases as Ek → 0 eV and suppresses the amplitudes of the oscillations. The Q1( ) & Q2 ( ) Rydberg series converge to the two lowest repulsive ionic states of H2+ and , respectively. These Rydberg states can autoionize to the bound ground state ion, or dissociatively ionize, or produce neutral fragments [2]. (1) (2) (3) (4) (5) Listed above are competing processes relevant for DPI. The energy difference between the H2+ & states is ~ 17eV in the Franck Condon (FC) region. If H2 is non-resonantly ionized into these two final states, the emitted photoelectrons will have different energies and process (1) and (2) would be readily distinguishable. Fig 1: The potential energy curves of the H2 and H2+ systems with the shaded area representing the ionisation continuum [3]. In the energy region h = 31-35 eV, are the Q1 (red curves) and Q2 (blue curves) states of & symmetry designated by full and dashed curves, respectively. The comparison with theory reveals, for the first time, the presence of the predicted oscillations in βH2as a function of Ek. There is a remarkable agreement in the phase and frequency of the oscillations at all three photon energies; the only minor exception being at ~13 eV in the h= 35 eV data. Fig 5: Variation of βH2with Ek for h= 31, 33 & 35 eV; close coupling calculations (black), measured data (red). Blue error bars on the at 9.9 and 13.9 eV indicate the uncertainty in the overall scale; Red error bars show the relative statistical uncertainty. • Fig 2: Semi-classical pathways for DPI by a 33 eV photon for processes (3-5). • Process (3): Resonant DPI through the lowest Q1 state • Processes (4,5): Resonant DPI through the lowest Q2 state leading to either H2+ • or states. Theoretical Analysis [5] Dehmer J L and Dill D Phys Rev A 1978 18 1 164 [6]Cooper J and Zare R N Lectures in Theoretical Physics vol ll c (New York: Gordon and Breach) 1969 p317-37 [7] Schmidt V Electron Spectrometry of Atoms using Synchrotron Radiation, (Cambridge University Press) 1997 pp 41-45, 364-366. (a) (b) (c) Fig 4: Ratio of angular distributions of the experimental data fitted with weighted least squares fit using (8). ratio fitted for h= 31 eV at photoelectron energies, a) 6.84 eV and 6.64 eV b) 5.44 eV and 5.24 eV c) 9.04 eV and 8.84 eV [1] Martín, F et al Science 2007 315 629 [2] Fernández, J and Martín, F New J. Phys 2009 11 043020 [3] Fernández, J and Martín, F Int. J. quant. Chem 2002 86 145 Fig 7: Variation of the electron asymmetry parameter, , associated with the H2+ ionization channel with electron energy for h = 33 eV. The black dashed curve is the result of our fullab initio calculations. (a) Top panel shows the dominant ℓ = 1 partial wave contribution. (b) Bottom panel shows the individual contributions of the 1Q11Su+ and 1Q21Pu amplitudes together with their coherent superposition, which gives rise to oscillations in . (a) (b) Toroidal Spectrometer The parameters were measured using a toroidal photoelectron spectrometer [4]. Electrons emitted in the plane orthogonal to the photon beam are focused on to the entrance slit of the toroidal analyzer. Energy analyzed electrons emerge from the toroidal exit slit to be focused on to a 2-dimensional position-sensitive detector, so preserving the initial angle of emission. The spectrometer was oriented so that electrons emitted at 0 and 90 to were both included in the final image. The photon energy resolution was ~10 meV at ~33 eV and the (angle-averaged) electron energy resolution was measured as 100 meV (FWHM) using He+(n=2) photoelectrons. Perpendicular Plane Geometry k, k1 & k2 Fig 3 : A schematic diagram showing the configuration of the two (partial) toroidal analyzers. Only the 180º analyzer was used for this experiment. Fig 6: The dominant contribution to the total (blue) is due to H2+ channels; the H2+ contributes only at low electron energy, as expected. The experiments were performed at the Canadian Light Source (CLS) , VLSPGMbeamline [4] Reddish et al 1997 Rev. Sci. Instrum. 68 2685 Funding Agencies: