Download
1 / 4
40 likes | 145 Views
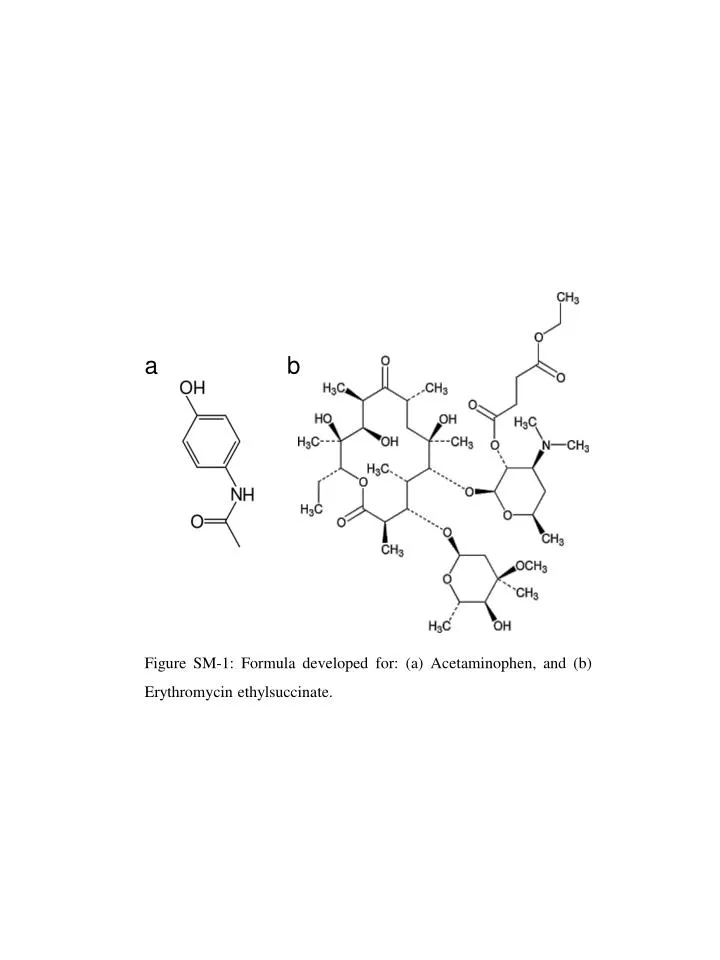
a. b. Figure SM-1: Formula developed for: (a) Acetaminophen, and (b) Erythromycin ethylsuccinate. a. b. c. B. B. A. A. ERY peak. A.

E N D
a b Figure SM-1: Formula developed for: (a) Acetaminophen, and (b) Erythromycin ethylsuccinate.
a b c B B A A ERY peak A Figure SM-2: Examples of EEM fluorescence spectra: (a) at pH 7.0 ± 0.1 of S-EPS from GS-Eer, (b) with quenching effects obtained for 135 µmol/L of ACE, and (c) for 755 µmol/L of ERY. The white arrows indicate areas of interest, i.e. peaks A and B.
Figure SM-3: Modeling of the fluorescence data from Figure S2 (B-EPS from GS-Eer) using the Stern-Volmer model. The F0/F curve is represented at the Ex/Em couple: 222 nm / 300 nm (aromatic protein region) (in blue), and 277 nm / 305 nm (soluble microbial by-product-like region) (in red).
Table SM-1: Identification and characteristics of the drugs used in this study (Clarke, 1986; Tolls, 2001)