Download
1 / 24
240 likes | 408 Views
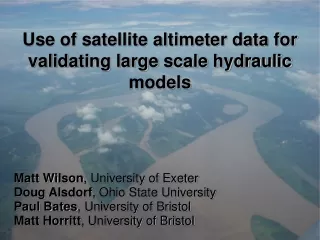
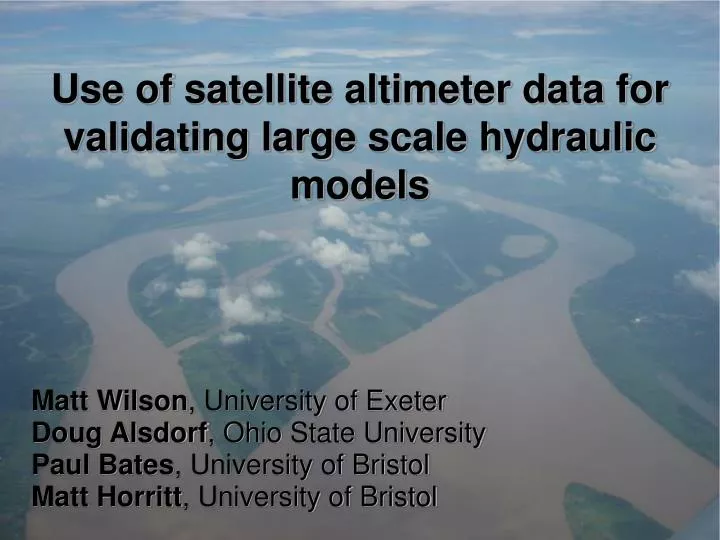
Use of satellite altimeter data for validating large scale hydraulic models. Matt Wilson , University of Exeter Doug Alsdorf , Ohio State University Paul Bates , University of Bristol Matt Horritt , University of Bristol. Hydraulic modelling of floodplains.

E N D
Use of satellite altimeter data for validating large scale hydraulic models Matt Wilson, University of Exeter Doug Alsdorf, Ohio State University Paul Bates, University of Bristol Matt Horritt, University of Bristol
Hydraulic modelling of floodplains • Flow on floodplains is controlled by topography and friction • Leads to complex spatial patterns of water depth and velocity that are 2D in space and dynamic in time • Until recently modelling of such flows has only been possible for small river reaches (10-50km)
New opportunities • Large scale modelling has now been made possible by: • Simplified 2D hydraulic models • Faster computers • New satellite data sources e.g. SRTM, satellite radars
LISFLOOD-FP • Hybrid 1D/2D model • Based on raster DEM • 1D Kinematic or diffusion wave routing in channel • Once bankfull depth is exceeded calculates a flux to floodplain cells using Manning’s equation or 2D diffusive wave to route water over complex floodplain topography Model discretization of floodplain and channel topography In-channel flow routed using a 1D wave equation Once bankful depth is exceeded water can flow laterally over adjacent low lying floodplains according to topography and free surface gradient
LISFLOOD-FP • Inundation is based on a simple continuity equation: where: V = cell volume t = time Qup, Qdown, Qleft and Qright= flow rates in each direction into (positive Q) and out of (negative Q) the cell
j i LISFLOOD-FP • Flux between cells calculated using the Manning equation where: Qi,j = flux between two cells i and j, Ai,j= cross sectional area at the cell interface, Ri,j= hydraulic radius at cell interface, Si,j= water surface slope between cells, n = Manning friction coefficient.
Simplified 2D models • Advantages • Floodplain flow is solved analytically rather than numerically so very efficient • 150-500k cells for full dynamic events should run in less than 1 day on a pc • Can use large elements (e.g. 250m – 1000m grids) • Intrinsically mass conservative treatment of floodplain flow • Disadvantages • Simplified floodplain flow representation • Wetting front propagation may be grid and time step dependent
LISFLOOD-FP • Successfully applied to reaches 10-50km in UK and continental Europe • We are now applying LISFLOOD-FP to 100-500km reaches
Solimões inflow Purus inflow 100 km
Amazon model implementation • 200x280km model domain, Purus and Solimões as 1D channels • 90m SRTM DEM averaged to 270m, processing for vegetation • Around ~800,000 cells • Simplified channel information • 4 year simulation, each annual hydrograph is the average of 20 years of gauged data
Some conclusions • Comparison of inundation extent using JERS image is useful but uncertain. • Altimetry data are a welcome addition, but miss the spatial complexity floodplain flows. • To capture these complexities, a two-dimensional approach is required.