Download

1 / 38
380 likes | 504 Views
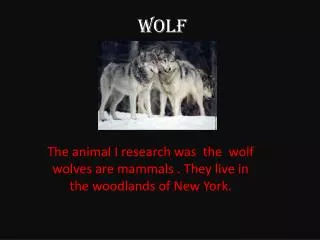
Wolf Depredations. Sandy Weisberg University of Minnesota School of Statistics March 14 2008. Wolves. “Wolves stir people’s emotions and attract public attention far out of proportion to their numbers.” Naughton-Treves, Groosberg and Treves (2003), Conservation Biology 1500-1511. Wolves.

E N D
Wolf Depredations Sandy Weisberg University of Minnesota School of Statistics March 14 2008
Wolves “Wolves stir people’s emotions and attract public attention far out of proportion to their numbers.” Naughton-Treves, Groosberg and Treves (2003), Conservation Biology 1500-1511
Wolf politics • Pro wolf: Young-to-middle aged, college-educated, affluent, urban, women • Hostile to wolves: Farmers and ranchers who must live with wolves. • Ecologists? Naughton-Treves, Groosberg and Treves (2003), Conservation Biology 1500-1511.
Wolf Management • 1849 to 1965: State managed a bounty program on wolves in Minnesota. • Depredation, or killing of livestock, was one of the reasons cited to justify this program. • During 1960s, about 190 wolves per year were killed, at $35 each. http://www.npwrc.usgs.gov/resource/mammals/minnwolf/history.htm
Wolf Management • 1967: Remaining wolves in lower 48 states mostly in Minnesota. Wolves classified as endangered, but not protected. • 1970: Wolves were protected in the Superior National Forest in Minnesota, and 1974 generally protected; wolves could be killed only if threatening humans. • Wolf control was a Federal responsibility
1978 status changed to threatened, allowed killing of wolves. • Depredation reported by farmer and verified by Minn DNR, or Federal Fish and Wildlife. • Farmer compensated for loss by state. • Trapping by Feds for up to 15 days within 0.8 km of site. Captured adults, and some pups, euthanized. Costs about $1M/year. • Trapping was not always done.
Source: MN DNR Source: MN DNR
Jan 14, 2009: Wolves delisted (again) • States are to be responsible for wolf management in Great Lakes Region. • How should wolf/human, wolf/livestock, and wolf/pet interactions be managed? • MN DNR planning documents modify Fed regulations in detail but not in general. http://www.fws.gov/Midwest/wolf/state-plans/index.htm
How should the State decide what to do about wolf depredations? • Introspection • Casual observation • Biology (plus simulation) • Let the courts decide • Politics • Data assisted decisions
Wisconsin data, October 2001 80 Bear hunters Livestock prod. 40 General pop. Seen Kills hound Kills pet Kills livestock 0 Naughton-Treves, Groosberg and Treves (2003), Conservation Biology 1500-1511
Data-assisted decisions • Experiments? • Quasi-experiments? • Observational studies • Harper, E., Paul, W., Mech, D., and Weisberg, S. (2008). Effectiveness of lethal, directed wolf-depredation control in Minnesota. Journal of Wildlife Management, 72, 778-84.
923 depredations 1440 wolves killed
Top 10 farms had 18% of depredations Poisson (black): 90 farms with zero Negative binomial: 775 farms with zero
Available data • Records of FWS on every reported depredation: Too much data • Not rectangular • Qualitative and quantitative • No obvious ‘treatment’ to study • No data on farms not effected
Available data • Farm characteristics: location, type, size, previous history, local conditions, management characteristics, … • Incident characteristics: Month and year, type of prey, distance to buildings,… • Trapping characteristics: was trapping done? What happened? Counts by sex, maturity, and so on. • What is the response?
Time to next depredation • Seasonal effects and year effectsas covariates • What physical scale? This farm? Within k km? Physical barriers (e.g., a river)? • Time scale: This year? Two years? When does a year start and end?
Comparison groups • No trapping done: why? (about 38 incidents) • Trapping was done, but no wolves were captured (360 incidents) • Trapping was successful; group by number of wolves killed (1 to 16)? (525 incidents)
Kaplan-Meier estimate • No trapping is very different, p < .001 • Similar for other radius, other Censoring time
Influence Analysis • In (at least) 4 cases, redepredation time was so short that trapping could not start. • In each case, trapping started shortly after the second incident. • These four very short redepredation times were classified as “No trapping” • Is this reasonable?
Proportional Hazards Models • Time of year covariates using sin(month/12) and cos(month/12) • Time period (early vs. late, or continuous) • Trapping vs. no trapping • Prey species • If trapping, indicators for breeding males, breeding females, nonbreeding males, nonbreeding females.
coxph in R m0 <- coxph(Surv(days, censored) ~ sin(month/12)+cos(month/12)+Species+ was.trapping+NumKilled)
The results • Modest seasonal adjustment. • Redepredation time varies according to prey species: sheep and turkey farms have higher hazard than cattle farms. • Trapping decreases hazard at 0 km, Dec. 31, but not for 0 km Oct. 31. • Removing breeding males apparently beneficial at 0 km with end = Oct. 31. • No interpretable effects at 8 km scale.
Four groups: p = 0.01 Breeding vs rest p=0.03
What does this mean? • Why is time to redepredation the “right” response? Or is it? • Implications for use of trapping to lessen depredation. • Can trapping be justified for other reasons? (Management, retribution?)
“…[W]e often do not know which is the best of several possible policies and, worse yet, that we may not know if any of them betters what we are now doing.” ---J. Gilbert, R. J. Light and Frederick Mosteller