Download
1 / 22

E N D
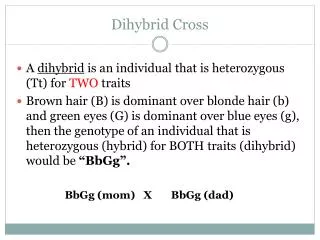
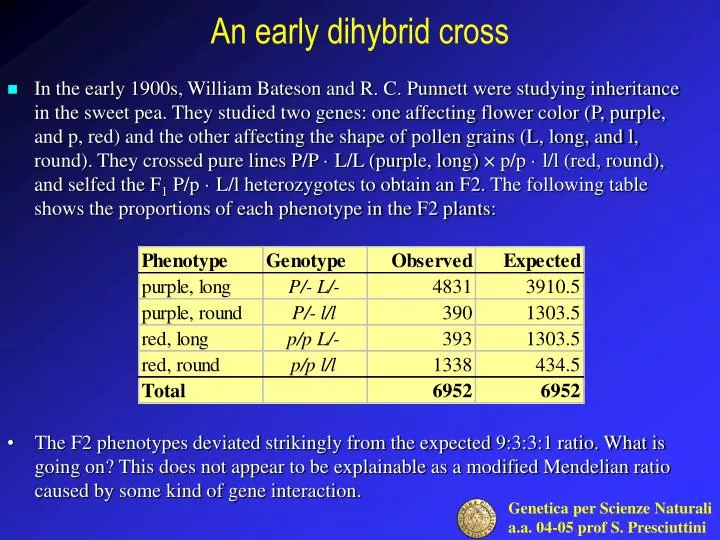
An early dihybrid cross • In the early 1900s, William Bateson and R. C. Punnett were studying inheritance in the sweet pea. They studied two genes: one affecting flower color (P, purple, and p, red) and the other affecting the shape of pollen grains (L, long, and l, round). They crossed pure lines P/P · L/L (purple, long) × p/p · l/l (red, round), and selfed the F1P/p · L/l heterozygotes to obtain an F2. The following table shows the proportions of each phenotype in the F2 plants: • The F2 phenotypes deviated strikingly from the expected 9:3:3:1 ratio. What is going on? This does not appear to be explainable as a modified Mendelian ratio caused by some kind of gene interaction.
Testing the segregation ratios in the Bateson-Punnett cross Analysis of phenotype proportions in F2 shows that both traits independently follow a typical 3:1 Mendelian ratio. As a possible explanation for this, Bateson and Punnett proposed that the F1 had actually produced more P · L and p · l gametes than would be produced by Mendelian independent assortment. Because these genotypes were the gametic types in the original pure lines, the researchers thought that physical coupling between the dominant alleles P and L and between the recessive alleles p and l might have prevented their independent assortment in the F1.
Comfirmation of coupling in Drosophila • The confirmation of Bateson and Punnett's hypothesis had to await the development of Drosophila as a genetic tool. • After the idea of coupling was first proposed, T. H. Morgan found a similar deviation from Mendel's second law while studying two autosomal genes in Drosophila. • One of these genes affects eye color (pr, purple, and pr+, red), and the other affects wing length (vg, vestigial, and vg+, normal). The wild-type alleles of both genes are dominant. Morgan crossed pr/pr · vg/vg flies with pr+/pr+ · vg+/vg+ and then testcrossed the doubly heterozygous F1 females: pr+/pr · vg+/vg (female) × pr/pr · vg/vg (males). • The use of the testcross is extremely important. Because one parent (the tester) contributes gametes carrying only recessive alleles, the phenotypes of the offspring reveal the gametic contribution of the other, doubly heterozygous parent. Hence, the analyst can concentrate on meiosis in one parent and forget about the other. This contrasts with the analysis of progeny from an F1 self, where there are two sets of meioses to consider: one in the male parent and one in the female.
Results of Morgan’s experiment • Morgan's results follow; the alleles contributed by the F1 female (double heterozygous) specify the F2 classes: • Obviously, these numbers deviate drastically from the Mendelian prediction of a 1:1:1:1 ratio, and they indicate a coupling of genes. The two largest classes are the combinations pr+ · vg+and pr · vg, originally introduced by the homozygous parental flies. You can see that the testcross clarifies the situation. It directly reveals the allelic combinations in the gametes from one sex in the F1, thus clearly showing the coupling that could only be inferred from Bateson and Punnett's F1 self. The testcross also reveals something new: there is approximately a 1:1 ratio not only between the two parental types, but also between the two nonparental types.
Repeating the cross • Morgan then repeated the crossing experiments but changed the combinations of alleles contributed as gametes by the homozygous parents in the first cross. In this cross, each parent was homozygous for one dominant allele and for one recessive allele: • The following progeny were obtained: • Again, these results are not even close to a 1:1:1:1 Mendelian ratio. Now, however, the largest classes are those that have one dominant allele or the other rather than, as before, two dominant alleles or two recessives. But notice that once again the allelic combinations that were originally contributed to the F1 by the parental flies provide the most frequent classes in the testcross progeny.
A hypothesis about coupling • In the early work on coupling, Bateson and Punnett coined the term repulsion to describe this situation, because it seemed to them that, in this case, the nonallelic dominant alleles "repelled" each other the opposite of the situation in coupling, where the dominant alleles seemed to "stick together." What is the explanation of these two phenomena: coupling and repulsion? • Morgan suggested that the genes governing both phenotypes are located on the same pair of homologous chromosomes. Thus, when pr and vg are introduced from one parent, they are physically located on the same chromosome, whereas pr+ and vg+ are on the homologous chromosome from the other parent. • This hypothesis also explains repulsion. In that case, one parental chromosome carries pr and vg+ and the other carries pr+ and vg. Repulsion, then, is just another case of coupling: in this case, the dominant allele of one gene is coupled with the recessive allele of the other gene. • This hypothesis explains why allelic combinations from P remain together, but how do we explain the appearance of nonparental combinations?
Crossovers • Morgan suggested that, when homologous chromosomes pair in meiosis, the chromosomes occasionally exchange parts in a process calledcrossing-over. The figure below illustrates this physical exchange of chromosome segments. The two new combinations are called crossover products. • Data like those just presented, showing coupling and repulsion in testcrosses and in F1 selfs, are commonly encountered in genetics. Clearly, results of this kind are a departure from independent assortment. Such exceptions, in fact, constitute a major addition to Mendel's view of the genetic world. • The residing of genes on the same chromosome pair is termedlinkage. Two genes on the same chromosome pair are said to be linked. • It is also proper to refer to the linkage of specific alleles: for example, in one A/a · B/b individual, A might be linked to b; a would then of necessity be linked to B.
Recombination • In modern genetic analysis, the main test for determining whether two genes are linked is based on the concept of recombination. • Meiotic recombination is any meiotic process that generates a haploid product with a genotype that differs from both haploid genotypes that constituted the meiotic diploid cell. • The product of meiosis so generated is called arecombinant. • Mendelian independent assortment may be reinterpreted in terms of recombination. • If we observe a recombinant frequency of 50 percent in a testcross, we can infer that the two genes under study assort independently. The simplest interpretation of such a result is that the two genes are on separate chromosome pairs. • However, genes that are far apart on the same chromosome pair can act virtually independently and produce the same result.
Recombination by crossing-over • Recombinants arise from meioses in which nonsister chromatids cross over between the genes under study. • For genes close together on the same chromosome pair, the physical linkage of parental allele combinations makes independent assortment impossible and hence produces recombinant frequencies significantly lower than 50 percent. • The recombinant frequency arising from linked genes ranges from 0 to 50 percent, depending on their closeness. Recombinant frequencies greater than 50 percent cannot be observed. • Note in the figure that crossing-over generates two reciprocal products, which explains why the reciprocal recombinant classes are generally approximately equal in frequency.
Interpreting linkage data • As Morgan studied more linked genes, he saw that the proportion of recombinant progeny varied considerably, depending on which linked genes were being studied, and he thought that these variations in crossover frequency might somehow indicate the actual distances separating genes on the chromosomes. • Morgan assigned the study of this problem to a student, Alfred Sturtevant. Morgan asked Sturtevant to make some sense of the data on crossing-over between different linked genes. • In one night, Sturtevant developed a method for describing relations between genes that is still used today. • In Sturtevant's own words, "In the latter part of 1911, in conversation with Morgan, I suddenly realized that the variations in strength of linkage, already attributed by Morgan to differences in the spatial separation of genes, offered the possibility of determining sequences in the linear dimension of a chromosome. I went home and spent most of the night (to the neglect of my undergraduate homework) in producing the first chromosome map."
Sturtevant approach • Imagine two specific genes positioned a certain fixed distance apart, and imagine random crossing-over along the paired homologs. • Sturtevant postulated a rough proportionality: the greater the distance between the linked genes, the greater the chance that nonsister chromatids would cross over in the region between the genes and, hence, the greater the proportion of recombinants that would be produced. • Thus, by determining the frequency of recombinants, we can obtain a measure of the map distance between the genes. Proportionality between chromosome distance and recombinant frequency. In every meiosis, chromatids cross over at random along the chromosome. The two genes T and U are farther apart on a chromosome than V and W. Chromatids cross over between T and U in a larger proportion of meioses than between V and W, so the recombinant frequency for T and U is higher than that for V and W.
The genetic map unit • In fact, we can define one genetic map unit (m.u.) as that distance between genes for which one product of meiosis in 100 is recombinant. Put another way, a recombinant frequency (RF) of 0.01 (1 percent) is defined as 1 m.u • A map unit is today referred to as a centimorgan (cM) in honor of Morgan • A direct consequence of the way in which map distance is measured is that, if 5 map units (5 cM) separate genes A and B whereas 3 m.u. separate genes A and C, then B and C should be either 8 or 2 cM apart. • Sturtevant found this to be the case. In other words, his analysis strongly suggested that genes are arranged in some linear order. Because map distances are roughly additive, calculation of the A-B and A-C distances leaves us with the two possibilities shown for the B-C distance.Of course, these two possibilities can be discriminated by examining the actual recombination frequency between B and C.
Linkage groups • The map obtained by recombination frequency analysis does not place the gene loci at specific places on the chromosome; it simply allows us to determine the positions of genes relative to one another (linkage groups). The small cluster of three genes could in theory be anywhere on the actual chromosome. However, as more and more recombination analyses are done with many more genes, the entire chromosome becomes "fleshed out." After the genes close to each chromosome end are placed in the map, and gene positions are determined by other techniques, can absolute chromosome position be assigned. • Genetic analysis works in two directions. In the case of linkage analysis, we have seen that by using RF measurements we can draw a genetic map; however, working in the other direction, if we have the map we can predict frequencies of progeny in different genotypic classes. • For example, if we know that the Drosophila autosomal genes Pr/pr and Vg/vg are linked on the same chromosome 11 cM apart, and if we testcross a trans dihybrid Pr vg/pr Vg to pr vg/pr vg, we can predict that there will be 11 percent recombinants. Furthermore, there should be 5.5 percent each of Pr Vg/pr vg and pr vg/pr vg because the two recombinant types are reciprocal products of the same type of crossover event. The remaining 89 percent will be nonrecombinant, 44.5 percent each of Pr vg/pr vg and pr Vg/pr vg.
An example of linkage map • A genetic map of the Drosophila genome, showing how each linkage group corresponds to one chromosome pair. Values are given in map units (cM) measured from the gene closest to one end. • Larger values are calculated as sums of shorter intervals because the recombinant frequency for any two loci cannot exceed 50 percent.
The vestigial phenotype On the left is a picture of a fruit fly with very small wings. This trait arose through a mutation in the vestigial gene, which codes for wing type. The fly on the left carries two copies of the mutant form of this gene. The fly shown on the right is the wild type. It carries two normal copies of this gene.