Download
1 / 27
280 likes | 459 Views
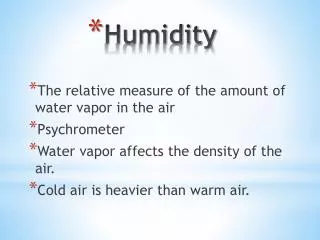
Humidity. These figures were all obtained from the National Climatic Data Center. Advection Fog. What are the conditions which favor advection fog?. Radiation Fog. Are the conditions for radiation fog different than those for advection fog?. Two views from the steps to the Quad.

E N D
These figures were all obtained from the National Climatic Data Center
Advection Fog What are the conditions which favor advection fog?
Radiation Fog Are the conditions for radiation fog different than those for advection fog?
Two views from the steps to the Quad Looking South Looking North
This is a cool morning at the end of summer when the water in the Hunt Union pond was very warm.
On the other hand, Radiation Fog tends to be located in valleys
From the satellite, you can see the fog in the valleys on a clear morning.
With apologies to Gedzelman, this figure is very misleading. HOW?
So, which of these are likely radiation fogs and which are probably advection fogs? Answer … Adv. Rad. Adv. Rad.+Upsl. Adv.+Rad.
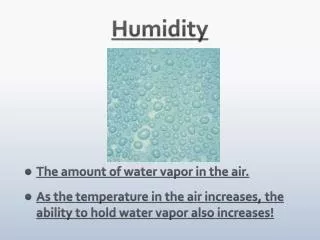
Another way humidity can be described is by cloudiness. How is a cloud different from a fog?
Here only the days which were completely cloudy were counted
For numbers, you should try the National Climatic Data Center (NCDC) www.ncdc.noaa.gov
Cloudiness can be quite seasonal. Notice the Lake Effect maximum.
By July, the number of cloudy days is way down and the Lake Effect is gone.
Here’s a different way to look at it. This also takes into account partly cloudy conditions.
Next exercise: Relative Humidity Climatology • Go to WeatherBase: www.weatherbase.com There you will find monthly and annual records for thousands of cities across the world. • Find Binghamton, NY (US). Its records start with Average Temperature:
3. Farther down, Binghamton’s record of average Evening Relative Humidity (RH) looks like this: 4. Using Excel, plot a line graph of the monthly values (no smoothing):
5. Next, find and graph the average evening RH for San Diego CA, Seattle WA (use Sea-Tac), Honolulu HI, Tallahasee, FL, and Lubbock, TX. Except for Seattle, use the entry with just the city name which is usually the main airport station. Put all data on the same graph with Binghamton. Give each city a different color and add that to the legend. Label the axes and put a suitably complete descriptive title on it. 6. Answer the following: a. How does the evening RH vary through the year at each station? b. What factors account for the differing RH values at each station through the year? c. What factors account for those differing evening RH values at your six stations? 7. Using Weatherbase, find a city in the U.S., other than the ones used here, which has a summer maximum, i.e., the average evening RH is greatest in June, July, or August. What factors account for the summer maximum in your city? 8. Using Weatherbase, find a city in the U.S., other than the ones used here, which has a winter maximum where the average evening RH is more than three times the summer minimum. What can account for the winter maximum in your city? Due next Wednesday
I added Yuma, AZ, Portland, OR, Barrow, AK, and Miama, FL to my graph. Yours should look something like this, with your cities replacing mine. Right- click on various parts to change how it looks, the axes, data, etc.