Download
1 / 27
270 likes | 590 Views
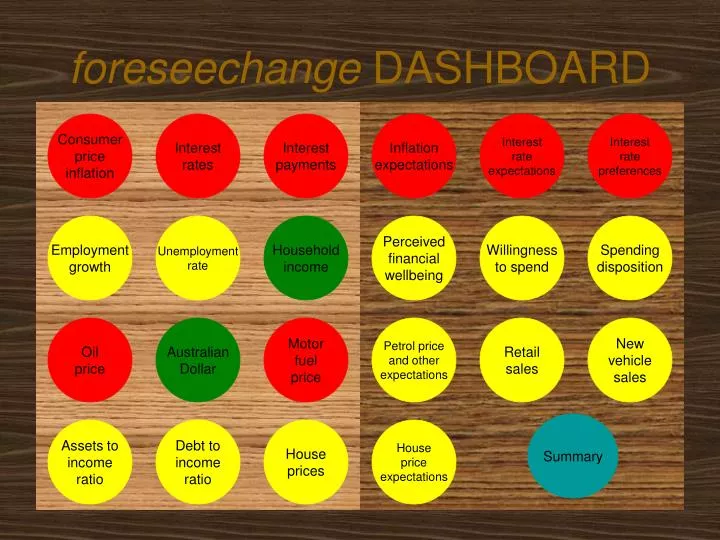
foreseechange DASHBOARD. Consumer price inflation. Interest rates. Interest payments. Inflation expectations. Interest rate expectations. Interest rate preferences. Employment growth. Unemployment rate. Household income. Perceived financial wellbeing. Willingness to spend.

E N D
foreseechange DASHBOARD Consumerpriceinflation Interestrates Interestpayments Inflationexpectations Interest rateexpectations Interestratepreferences Employmentgrowth Unemploymentrate Householdincome Perceivedfinancialwellbeing Willingnessto spend Spendingdisposition Oilprice AustralianDollar Motorfuelprice Petrol price and otherexpectations Retailsales Newvehiclesales Summary Assets toincomeratio Debt toincomeratio Houseprices Housepriceexpectations
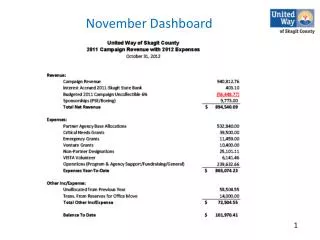
Dashboard Summary as at 3 July 2008 • There are signs of a slowdown in retail sales growth in the figures to May • Growth was expected to slow to 6% or slightly less due to rising interest rates • There was no growth in seasonally adjusted month-to-month figures between November and April • Higher interest rates and petrol prices are acting as brakes and sluggish house price growth is also a factor • New vehicle sales to May are still setting records although sales peaked, in seasonally adjusted terms, in December 2007 and January 2008 • Consumer perceived financial wellbeing was very strong in late 2007, supported by strong income growth and house price growth but has weakened a little in the April 2008 survey • There has been a large increase in the proportion of discretionary income that consumers allocate to loan repayment – although this has come at the expense of saving rather than spending • Employment growth has slowed since February, reflecting a slump in business confidence • Any further negative shocks, such another interest rate rise, a rise in unemployment, continued high petrol prices, or a slump in house prices could have a disproportionate impact on consumer spending • A further round of tax cuts in July will boost disposable income although most of this money will initially flow into loan repayment and saving rather than spending
Consumer Price Inflation Dashboard The underlying inflation (weighted median and trimmed mean) measures strip out volatile items(these items vary over time) which could cause one-off distortions. All three measures show price inflationaccelerated alarmingly in the March quarter, to an annualised rate of over 5% (the upper bound, which is equivalent to an annual rate of 3%, is the top of the target band of 2% to 3%)
Interest Rates Dashboard Interest rates have been rising since May 2002. The Reserve Bank of Australia is charged withkeeping consumer price inflation in the range 2% to 3% and recent concerns about acceleratinginflation has resulted in four interest rate rises in the last 12 months. In addition, banks have addedto the official rate increases due to their increasing cost of funding following the US sub-prime crisis.
Interest Payments Dashboard Interest payments as a proportion of household disposable income are much higher at nearly 12%compared with the previous record of 9.3% when interest rates were at a record high in 1990. Interestpayments fell sharply in the early 1990’s as interest rates dropped rapidly, but no such relief can beexpected in the near future.
Inflation Expectations Dashboard The Reserve Bank of Australia would be concerned that consumer price expectations have increased since 2005and have been well above the target band of 2% to 3%. The fear is that these expectations will translate intowage demands and thus fuel an inflationary spiral. Continued expectations above 4% would encourage theReserve Bank to lift interest rates.
Interest Rate Expectations Dashboard Most adults have been expecting interest rates to rise and have been making their purchasing and investmentdecisions with that accurate expectation. Virtually no-one expects a cut in interest rates.
Interest Rate Preferences Dashboard Interest rate sensitivity has increased. Just under 40% wanted interest rates to fall but this has increased to 56% recently.A further 16% want higher interest rates because they are net recipients of interest. The latter are typically over the age of 55 but there are some in every age group who want higher interest rates.
Employment Growth Dashboard Strong employment growth is one driver of robust household income growth. It is also an important driver ofnew vehicle sales. There has been virtually no growth in employment since February 2008, reflecting a slumpin business confidence.
Unemployment Rate Dashboard The unemployment rate is rising from a 30 year low. Employment growth has been strong enough to reduce unemploymentdespite increases in the labour force. The Reserve Bank of Australia is more likely to increase interest rateswhen unemployment falls to a new low as this may increase the risk of higher wage demands.
Household Income Dashboard Household disposable income is growing rapidly. This is in part due to strong employment growth and in part due to large tax cuts enacted in recent budgets. While growth slowed in the March 2008 quarter, it is still much stronger thanin 1991 and 2002 – the last times Australia’s economy slowed significantly.
Perceived Financial Wellbeing Dashboard Definitions In late 2007, more people than ever felt that they have discretionary spending power (No Worries plus Comfortable segments).It seems that positive factors such as tax cuts and employment growth were more than offsetting negative factorsincluding higher interest rates Economic shock since have reduced the proportion with discretionary spending power.
Willingness to Spend Dashboard Definitions Most discretionary funds would go to repaying debt, followed by saving and then spending. Willingness to spendfell in 2004 and has not recovered to the boom time level of 2003 as yet. The April 2008 survey found a big increasein the amount allocated to debt repayment – most of that coming from saving rather than spending.
Spending Disposition Dashboard Definitions The most influential segment is the Profligate Spender segment (both willing and able to spend) whichshrank in 2004 and 2005 at the same time that retail sales growth slowed. The Profligate Spender segment, which had recovered by late 2007, has shrunk in 2008 but not to the 2005 level.
Oil Price Dashboard The price of a barrel of oil has increased from less than $12 at the end of 1998 to over $130 in June 2008,an increase of 1,000% in less than ten years. The price has doubled in the last 12 months. The price has peaked at over $140 in July 2008 so far. Rapidly rising fuel prices dampen consumer spending and investment as well as lifting transportation andfood production costs, potentially leading to higher interest rates.
Australian Dollar Dashboard The Australian dollar is at its highest since the early 1980’s. High interest rate differentials and booming commodity priceshave contributed to this although there would be a speculative component and sentiment may change when it is felt thatthe dollar has peaked. The high dollar tends to be good for importers and makes life difficult for exporters. It is keepingthe price of imports (including petrol) cheaper than would otherwise be the case and so is boosting consumer spending.
Motor fuel price index Dashboard When fuel prices are rising rapidly, consumer spending and also investment tend to be restrained with a short time lag. Priceincreases flow into transport and other costs boosting price inflation more generally. We have been protected from theworst of oil price rises recently by the strong Australian dollar.
Consumer Expectations Dashboard Wisdom of theMasses In October 2007, consumers attached a likelihood of 80% that petrol prices would rise in 2008. This would impactdecisions on what type of car to buy and where to live. Clear signs of global warming was also seen a highlylikely event in 2008.
Assets to Income Ratio Dashboard During the late 1980’s and early 1990’s, household assets were close to five times disposable income. The ratio hasaccelerated since to well over 800 although the negative impact of the early 2008 stockmarket correctionhas not yet been published. Strong growth in assets boosts consumer spending.
Debt to Income Ratio Dashboard Debt has grown steadily as a proportion of household disposable income. While assets are much higher, at eight timesdisposable income, people with the most assets not the same people who have the same debt. Continued growth in thisratio, combined with rising interest rates will tend to dampen consumer spending growth.
House Prices Dashboard House price inflation boosts consumer spending growth. Higher prices can be accessed easily by homebuyerswho can redraw equity at lower interest rates than available by credit cards. Also, higher house prices make homeownersfeel more wealthy. The pause in house price inflation in 2004 and 2005 coincided with a sudden slowdown in retailsales growth. Price inflation may slow given higher interest rates over the pas six months.
House Price Expectations Dashboard In 2003, considerably more people expected house prices to rise than expected them to fall and then the gap narrowedfrom late 2003 until late 2006. The gap is now negative after a strong 2007. Should these perceptions persist, it islikely that discretionary consumer spending would slow.
Retail Sales Growth Dashboard Retail sales growth has slowed in recent months but it is too early to call a significant slowdown. The brief slowdown in2004 and 2005 was due to the simultaneous rapid rise in petrol prices and the pause in house price inflation.These same factors are the biggest potential threat to consumer spending growth in 2008.Spending growth is expected to remain at about 5%. The July 2008 tax cuts will be a positive factor.
New Vehicle Sales Dashboard New vehicles continue to sell at record levels although sales clearly peaked in December 2007 and January 2008.Driving forces include strong employment growth and the high Australian Dollar (which reduces import prices).Rising interest rates and a surge in the price of petrol are acting to slow sales growth.
Consumer Pulse Dashboard • Ability to spend and save is measured by perceived financial wellbeing. Survey respondents are asked to self-classify into four segments: • I never seem to have enough money these days (labeled as “Broke”); • I manage to meet all my expenses but there’s not really anything left over (“Struggling”); • I can afford to spend on those extras that make life worthwhile (“Comfortable”); • I have few financial concerns, being both able to save and buy the things I want (“No Worries”). • Willingness to spend and save is measured by asking survey respondents how a (hypothetical) discretionary $1,000 would be allocated across saving, spending, and loan repayment. The $1,000 could be from savings or a tax return. • Spending disposition combines these measures • Frugal Spenders are neither able nor willing to spend • Frustrated Spenders are willing to spend but have no spare cash • Reluctant Spenders are able to spend but now willing to do so • Profligate Spenders are both willing and able to spend • The survey is administered by telephone to nationally representative random samples of 500 adults
The wisdom of the masses Dashboard Trends • In his book “The Wisdom of Crowds”, James Surowiecki makes a compelling case that if you want to make a correct decision then large numbers of ordinary people can provide better advice than a small number of experts. • Surowiecki shows that if you ask a large enough sample of diverse, independent people to make a prediction or estimate a probability, and then average those estimates, the errors each individual makes in coming up with an answer will cancel themselves out. Each persons guess has two components: information and error (or signal and noise). The process of averaging tends to cancel out the errors, leaving the information. • The opinions of consumers are important in another way. They provide insight into what consumers are expecting to happen. For example, expectations will lead to the next big population movement and this information indicates where the destinations will be. The opinions will not only be a factor influencing their behaviour - it will also indicate perceived risks which they will expect governments and businesses to address. • Wisdom of the masses surveys have been conducted annually by foreseechange since 2005, based on a nationally representative telephone survey of 500 adults
Risk perceptions trends Dashboard