Download
1 / 20
210 likes | 332 Views
Winter-Quiz- Intermezzo. On each slide you will find a screenshot from R-studio / or some previous t heoretical statistical class material. You can find program code or description/definition for the presented screenshot’s content in the class slides

E N D
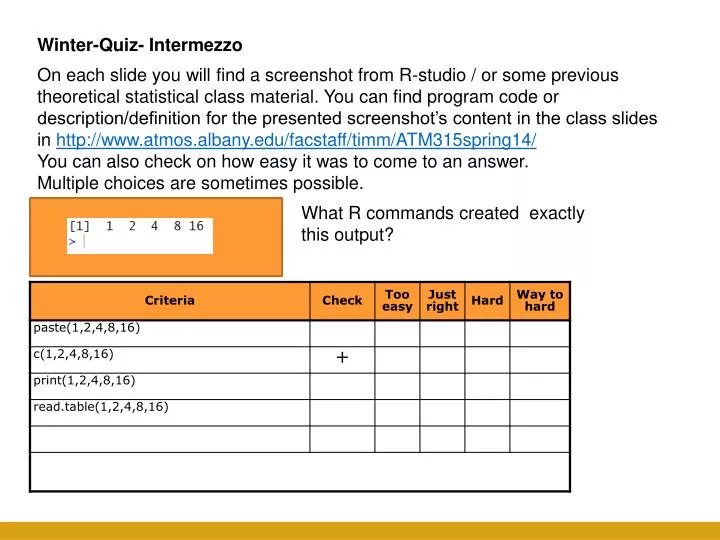
Winter-Quiz- Intermezzo On each slide you will find a screenshot from R-studio / or some previous theoretical statistical class material. You can find program code or description/definition for the presented screenshot’s content in the class slides in http://www.atmos.albany.edu/facstaff/timm/ATM315spring14/ You can also check on how easy it was to come to an answer. Multiple choices are sometimes possible. What R commands created exactly this output?
Winter-Break Quiz What R command created this output at the command console >?
Winter-Break Quiz [1] 5 What R commands created this output at the command console >?
Winter-Break Quiz What R commands created this output at the command console >?
Winter-Break Quiz What R commands created this output at the command console >?
Winter-Break Quiz What R commands created this output at the command console >?
Winter-Break Quiz What R-code gives this result?
Winter-Break Quiz What R-code gives this result?
Winter-Break Quiz Consider you have been given the following daily minimum temperatures all in units of degree Celsius [C]: -1, 4, -10, -19, 0, 20, 3, 4, -5, -6 Later it turned out, the 20 C was an error and should have been 2. You calculated the arithmetic mean with the erroneous value included. How much do you expect the error to affect the mean estimation Less than 10% About 2 degrees C About 10% of the error in the erroneous value The random error cancels out in the calculations
Winter-Break Quiz Consider you have been given the following daily minimum temperatures all in units of degree Celsius [C]: -1, 4, -10, -19, 0, 20, 3, 4, -5, -6 Later it turned out, the 20 C was an error and should have been 2 You calculated the median with the erroneous value included. How much do you expect the error to affect the median estimation? 9 degrees In general less than the mean In general more than the mean The sample size is even, and median estimate makes no sense
Winter-Break Quiz Consider you have been given the following daily minimum temperatures all in units of degree Celsius [C]: -1, 4, -10, -19, 0, 20, 3, 4, -5, -6 Later it turned out, the 20 C was a error and should have been 2 You calculated the variance with the erroneous value included. What effect does this outlier have on the variance estimate ? It increases the variance by no more than 10% The variance is overestimated The variance increases by about 10 deg C The variance is about 2 time larger if the erroneous value is included
Winter-Break Quiz Consider you have been given the task to measure the size of a rectangular parking lot: You measure both sides a, b 5 times in units of ft, independently from each other. (i.e. you first measure a, afterwards b) For b you get: 510, 498, 512, 495, 497 For a you get: 150, 151, 148, 149, 152 What is the best estimate for mean of the area F? Area F a b First I calculate the averages for a and b, then I multiply them. I use the five values of a and the five of b, and multiply them to get five estimates for F and then I get the average for F I use all 25 combinations from the five length measurements of a and the five of b to estimate the area F, then I calculate the average. I only need one pair of values from the measurements. Using more does not reduce the error in my estimate, because they are independent samples of the same quantities
Winter-Break Quiz Magnus formula: Consider you have been given temperature observations in degree Celsius on a summer day: 20, 24, 21, 30, 32, 18, 19 But no direct observations for water vapor saturation pressure was possible. What is the best estimate for saturation pressure of water vapor on that day using the Magnus formula (see web directory scripts/myfunctions.R)? Either way, I first average the temperature and convert the average temperature with the Magnus formula, or I can calculate for each temperature the saturation pressure and then take the average First I calculate the average temperature and then use the Magnus formula with the average temperature Who cares? Statistics is only a theoretical concept. I trust the measurements more than the statistical estimates. To avoid a bias in my estimated mean saturation pressure, I first calculate for each temperature the saturation pressure, and then I take the average of the 7 pressure values.
Winter-Break Quiz You have plotted the monthly mean air temperatures from Albany airport over the last 30 years. What is the periodic cycle in this figure? In fact all these ups and downs are random, they just appear organized in this type of plot. The seasonal cycle with coldest temperatures during winter and warmest during summer There is no evidence for a dominant periodic cycle. Thirty years are way too short to see any cycles.
Winter-Break Quiz The temperature data from the previous plot are plotted here in a histogram with temperatures on the x-axis in F. What does it mean when you see the bar located just below the 70F mark on the x-axis reaches the mark 50 on the y-axis? The histogram shows the climatological seasonal cycle. maximum temperatures were reached in the middle of the cycle after 50% was completed. Starting in January, that means in July. Histograms are just a fancy way for statisticians to manipulate the real meaning of the data. There is no relationbetween frequencies and temperatures The histogram shows how often temperatures fall into a specific temperature range. The temperature range 65-70 F was observed in about 50 months. The Histogram measures the period of the cycles in the time series. A frequency of 50 means a period of half a year. The bar at 65-70 F is our seasonal cycle.
Winter-Break Quiz You observe a gambler on the street having a winning streak of 19 consecutive wins (i.e. he predicted the top side of the coin 19 timesright). What are the chances he/she extends in the next game his streak to a phenomenal 20? (Assume a fair game: no coin manipulation) 1/2 to the power of 20 (<0.0001%) After 19 times guessing right, it is long overdue That the gambler looses on his/her next guess. His chances decrease with every toss by 1/2 His chances are 50%
Winter-Break Quiz You observe a gambler on the street having a winning streak of 19 consecutive wins (i.e. he predicted the top side of the coin 19 timesright). With every win he doubled his previous prize money. He had $2 after the first, $4 after the second. How much money is on the table for the gambler, if he/she wins the 20th toss again. 2*$20=$40 $2^20=1048576 $20^2=$400 More than a million
Winter-Break Quiz Shown on the left is the global mean temperature Anomaly time series (annual means) from 1850 to 2010. If two gamblers played the game of predicting the global mean temperatures from 1950 to 2010. Player 1 always puts $1 on “next year will be cooler than this year” Player 2 always puts $1 on “next year will be warmer than this year” Who would have made more money by the end of 2010? The winner earns the $2. Both will have more or less the same, because the fluctuations are still randomly going up and down. Player 1 will have more, because there are more sharp kinks downward than upward. Player 2 will have more, because there is a general upward trend on top of the random fluctuations. Since weather is not predictable for more than 5, 10 maybe 14 days there exists no predictable trend in the climate. Both players are loosing in the end trying to predict the unpredictable.
Winter-Break Quiz Shown on the left is the global mean temperature Anomaly time series (annual means) from 1850 to 2010. If two gamblers played the game of predicting the global mean temperatures from 1950 to 2010. Player 1 always puts $1 on “next year will be cooler than 1950” Player 2 always puts $1 on “next year will be warmer than 1950” Who would have made more money by the end of 2010? The winner earns the $2. Both will have more or less the same, because the fluctuations are still randomly going up and down. Player 1 will have more, because there are more sharp kinks downward than upward. Player 2 will have more, because there is a general upward trend on top of the random fluctuations. Since weather is not predictable for more than 5, 10 maybe 14 days there exists no predictable trend in the climate. Both players are loosing in the end trying to predict the unpredictable.
Winter-Break Quiz Consider you have taken already 30 measurements of the daily rainfall amounts at one station here in NY. (your research focus is on days with measurable rainfall during mid-latitude storms). You already calculated the average rainfall. The next day a tropical storm dumps 10 times the average rain amounts. How much do you expect the average to change when you include this extreme event? I can expect about a 30% change from the old to the new average rainfall estimate. With already 30 measurements a single get’s only a small weight of 1/30 (about 3%). This depends on the actual values. Without that I cannot make any quantitative statement. I decide to exclude this observation, because my research project is about extra-tropical storms.