Download
1 / 41
410 likes | 578 Views
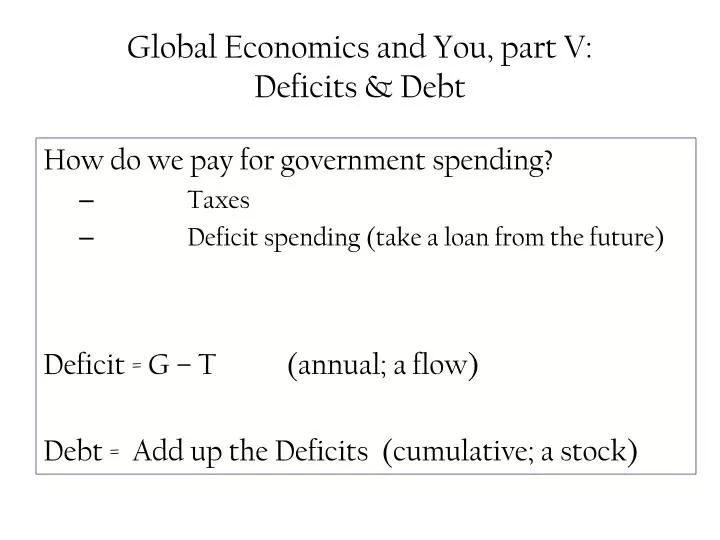
Global Economics and You, part V: Deficits & Debt. How do we pay for government spending? Taxes Deficit spending (take a loan from the future) Deficit = G – T (annual; a flow) Debt = Add up the Deficits (cumulative; a stock). Indebtedness of the world’s governments.

E N D
Global Economics and You, part V: Deficits & Debt How do we pay for government spending? • Taxes • Deficit spending (take a loan from the future) Deficit = G – T (annual; a flow) Debt = Add up the Deficits (cumulative; a stock)
Ratio of U.S. govt debt to GDP WW2 Iraq War Revolutionary War WW1 Civil War
The U.S. experience with Debt 1980s - 1990s debt-GDP ratio: 25.5% in 1980, 48.9% in 1993 due to Reagan tax cuts, increases in defense spending & entitlements 1990s - 2000 $290b deficit in 1992, $236b surplus in 2000 debt-GDP ratio fell to 32.5% in 2000 due to rapid growth, stock market boom, tax hikes
The U.S. experience in recent years Early 2000s the return of huge deficits, due to Bush tax cuts, 2001 recession, Medicare expansion, Iraq war The 2008-2009 recession fall in tax revenues huge spending increases (bailouts of financial institutions and auto industry, stimulus package)
Federal Debt and Deficit • Surplus in 4 of last 25 years.
Troubling long-term fiscal outlook The U.S. population is aging. Health care costs are rising. Spending on entitlements like Social Security and Medicare is growing. Deficits and the debt are projected to significantly increase…
Percent of U.S. population age 65+ 23 Percent of pop. actual projected 20 17 14 11 8 5 2030 2040 2050 1970 1980 1990 2000 2010 1950 1960 2020
U.S. government spending on Medicare and Social Security 8 6 4 2 0 1995 2000 2005 1965 1970 1975 1980 1985 1950 1955 1960 1990 Percent of GDP
CBO projected U.S. federal govt debt in two scenarios pessimistic scenario optimistic scenario 300 250 200 Percent of GDP 150 100 50 0 2005 2010 2015 2020 2025 2030 2035 2040 2045 2050
Is the govt debt really a problem? Consider a tax cut with corresponding increase in the government debt. Two viewpoints: 1. Traditional view 2. Ricardian view
The traditional view Yes, the Debt matters – in the long run Short run: Consumption, Unemployment Long run: Consumption and Unemployment back at their natural rates But Real interest rates, Investment Crowding out private investment
The Ricardian view No, debt is not a problem As argued by David Ricardo (1820) and Robert Barro (2010) According to Ricardian equivalence, a debt-financed tax cut has no effect on consumption, national saving, the real interest rate, investment, net exports, or real GDP, even in the short run.
The logic of Ricardian Equivalence Consumers are forward-looking—a debt-financed tax cut today has to be paid for with a future tax increase. The tax cut does not make us better off, so we do not increase consumption. Instead, we save the full tax cut to repay the future tax liability. Result: Private saving rises by the amount public saving falls, leaving national saving unchanged.
People increase saving in anticipation of future tax increases. • This causes a reduction in private sector spending that is exactly equal to the increase in government spending. • Deficit spending is not stimulative. It has no effect whatsoever. • This implies fiscal policy is useless at best. • Activist policy cannot work!
Problems with Ricardian Equivalence Myopia: Not all consumers think so far ahead, some see the tax cut as a windfall. Borrowing constraints: Some consumers cannot borrow enough to achieve their optimal consumption, so they spend a tax cut. Future generations: If consumers expect that the burden of repaying a tax cut will fall on future generations, then a tax cut now makes them feel better off, so they increase spending.
Evidence against Ricardian Equivalence? 1980s: Reagan tax cuts increased deficit. National saving fell, real interest rate rose 1992:Income tax withholding reduced to stimulate economy. This delayed taxes but didn’t make consumers better off. Almost half of consumers increased consumption.
Evidence against Ricardian Equivalence? Proponents of R.E. argue the Reagan tax cuts did not provide a fair test of R.E. Consumers may have expected the debt to be repaid with future spending cuts instead of future tax hikes. Private saving may have fallen for reasons other than the tax cut, such as optimism about the economy. Because the data is subject to different interpretations, both views of govt debt survive.
OTHER PERSPECTIVES: Balanced budgets vs. optimal fiscal policy A balanced federal budget every year? Economists reject this proposal, arguing deficit should be used to: stabilize output & employment smooth taxes in the face of fluctuating income redistribute income across generations when appropriate
OTHER PERSPECTIVES: Debt and politics “Fiscal policy is not made by angels…” – Greg Mankiw, p.487 Trust policymakers with deficit spending? They argue : policymakers neglect true costs of their spending since burden falls on future taxpayers since future taxpayers cannot vote, their interests are ignored
OTHER PERSPECTIVES: Fiscal effects on monetary policy Printing money? Inflation Not too popular in most countries
Taxes: the price to live in a civilized society "I like paying taxes. With them I buy civilization." Justice Oliver Wendell Holmes • Dueling tax plans
"Let me try to put each tax plan into a single number. Suppose you earn a dollar today and decide to invest it for your kids. How much, as a result, will he leave his kids in T years?The answer depends on four tax rates. First, combined income and payroll tax on the dollar earned. Second, the corporate tax rate while the money is invested in a firm. Third, the dividend and capital gains rate as you receive that return. Fourth, the estate tax when you leave what has accumulated to my kids.Let t1 be the combined income and payroll tax rate, t2 be the corporate tax rate, t3 be the dividend and capital gains tax rate, and t4 be the estate tax rate. And let r be the before-tax rate of return on corporate capital. Then one dollar you earn today will yield yourkids: (1-t1){[1+r(1-t2)(1-t3)]^T}(1-t4).
Assume • r to be 10 percent and • remaining life expectancy T to be 35 years.If there were no taxes, so t1=t2=t3=t4=0, then $1 earned today would yield my kids $28. • That is simply the miracle of compounding.Under the McCain plan, t1=.35, t2=.25, t3=.15, and t4=.15. • In this case, a dollar earned today yields my kids $4.81. • Even under the low-tax McCain plan, the incentive to work is cut by 83 percent compared to the situation without taxes. • Under the Obama plan, t1=.43, t2=.35, t3=.2, and t4=.45. • In this case, a dollar earned today yields my kids $1.85. • Obama's proposed tax hikes reduce my incentive to work by 62 percent compared to the McCain plan and by 93 percent compared to the no-tax scenario. • In a sense, putting the various pieces of the tax system together, I would be facing a marginal tax rate of 93 percent.The bottom line: • If you are trying to induce me to do some work for you, there is a good chance I will turn you down.
Taxes on Economic “Flows” Most taxes are levied on measurable economic flows. For example, a profits, or net income, tax is levied on the annual profits earned by corporations.
Proportional, Progressive,and Regressive Taxes A proportional tax is a tax whose burden is the same proportion of income for all households.
Proportional, Progressive,and Regressive Taxes A progressive tax is a tax whose burden, expressed as a percentage of income, increases as income increases.
Proportional, Progressive,and Regressive Taxes • A regressive tax is a tax whose burden, expressed as a percentage of income, falls as income increases. • Excise taxes (taxes on goods) are regressive. • The retail sales tax is also regressive.
Marginal versus Average Tax Rates The average tax rate is the total amount of tax you pay divided by your total income. The marginal tax rate is the tax rate you pay on any additional income you earn.
Marginal versus Average Tax Rates Marginal tax rates influence behavior. Decisions about how much to work and how much to invest depends in part on the after-tax return.
Tax Equity One theory of fairness is called the benefits-received principle, which holds that taxpayers should contribute to government (in the form of taxes) in proportion to the benefits that they receive from public expenditures.
Tax Equity Another theory of fairness is called the ability-to-pay principle, which holds that citizens should bear tax burdens in line with their ability to pay taxes.
What is the “Best” Tax Base? • The three leading candidates for best tax base are: • Consumption • Income • Wealth
Consumption as the Best Tax Base • If we want to redistribute well-being, the tax base should be consumption because consumption is the best measure of well-being.
Income as the Best Tax Base Supporters of the use of income as the tax base argue that your ability to pay is your ability to command resources. It is your income that enables you to save or consume, and it is income that should be taxed regardless of its sources and uses.
Wealth as the Best Tax Base Supporters of the use of wealth as the tax base argue that the real power to command resources comes not from income but from accumulated wealth.
Tax Incidence: Who Pays? Tax incidence refers to the ultimate distribution of a tax’s burden. Tax shifting occurs when households can alter their behavior and do something to avoid paying the tax.
Measuring Excess Burdens • An excise tax that raises the price of a good above marginal cost drives some consumers to buy less-desirable substitutes, reducing consumer surplus. A tax that alters economic decisions imposes a burden that exceeds the amount of taxes collected.