Download
1 / 20
200 likes | 439 Views
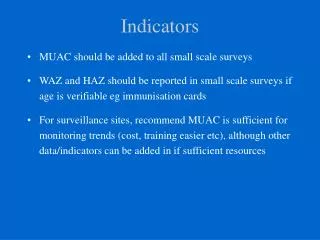
Exploring Poverty Indicators. 5th - 9th December 2011, Rome. Outline. What is poverty? Dimensions of poverty Overview of the Cost of Basic Needs (CBN) poverty line approach Construction of the poverty line Determining the cost of the food basket Aggregate poverty indicators.

E N D
Exploring Poverty Indicators 5th - 9th December 2011, Rome
Outline • What is poverty? • Dimensions of poverty • Overview of the Cost of Basic Needs (CBN) poverty line approach • Construction of the poverty line • Determining the cost of the food basket • Aggregate poverty indicators
What is poverty? • Poverty is therefore an abstract concept with multiple dimensions • There is no consensus on how to measure poverty, even when examining only one dimension
Dimensions of poverty • Single or multiple dimensional measures • Example: Human Development Index (life expectancy, education, living standards) • Material or non material • Example: Income, assets, education, freedom • Objective or subjective • Participatory Poverty Assessment • Uganda; both objective and own assessment of poverty • Means to meet basic needs • 2200 kcal per day or means to achieve 2200 kcal per day
Dimensions of poverty • All of these dimensions are important for comprehensive poverty analysis and for creating poverty profiles • In this training we will focus on monetary poverty – whether an individual has enough resources to cover his/her basic needs. • This is the approach that gets the most attention and also the most demanding to calculate
Cost of Basic Needs (CBN) approach • The CBN approach attempts to establish the cost of a bundle of goods that ensures that a household’s basic needs are met • The cost of those goods is used to establish a poverty line
CBN poverty line • The poverty line reflects the monetary cost of what is considered to be the minimum required in order to remain out of poverty • It is defined in relation to the living standards of a particular society at a single point-in-time • The poverty line must adapt to changes in the standard of living of the society • The poverty line has two components: • Food • What is the minimum caloric requirement for a household? • Non-food • What are the essential non-food purchases and what is their total cost?
Steps in calculating the CBN poverty line • Determine the minimum calorie requirement • Define the basket of goods to attain that requirement • Estimate the cost of obtaining the food basket (food poverty line) • Estimate the non-food component
Data required for creating the food poverty line • Quantity consumed • Converted into a common unit such as kilograms, liters, etc. • Price for each item • Calorie content of each food item • Usually kilocalories / 100 grams This should all look familiar!!!
Using consumption data instead of income data • Fluctuations in income data are typically smoothed, hiding the current status • Consumption is more representative, particularly in agricultural economies • Income data is not easily gathered for many income activities, such as self-employment • Households are more likely to truthfully report their consumption than their income • Consumption data is more expensive to collect but is conceptually clearer
Consumption aggregate • The consumption aggregate is the value of all goods and services used by the household (food and non-food items) • The value of food consumption includes: • Expenditure on purchases • Consumption of own production • Gifts and in-kind food • The consumption is then converted into a monetary value • The aggregate aims to give an estimate on the welfare level in the household using the value of their consumption; therefore savings do not contribute to this defnition of wealth
Non-food component • The non-food component includes items such as: • Non-food consumable goods • Durable goods • Housing and shelter • Other housing expenses • Transportation • Education • Health • Large purchases are not included (for example a car); Instead ‘user values’ are utilized which require information on the lifespan of assets, their age, and their value at the time of purchase and now
Food basket • The basket should reflect the basic food needs as commonly eaten by the poor • First define “the poor” reference population; for example: • The poorest 50% • The 5th and 6th decile of the consumption aggregate • Chose deciles to avoid the poorest part of the population that will have a non-representative consumption pattern • Rank all individuals by household consumption per capita and choose the reference population
Establish the food basket for the reference population • To determine the value of the food basket, select households in the reference population • Calculate the average consumption of each food item consumed (xi) • Calculate median “unit values” (pi) • Unit value is the price paid by each household • Calculate the median price paid in the population • This yields the cost of the basket: • + + …
Calculating the food poverty line • Calculate the average calorie intake for the referencepopulation • Scale the cost of the basket to achieve the average kilocalorie per capita consumption of the entire population • If the average calorie intake in the reference population is 2,000 and the average consumption of the entire population is 2,400 the cost of the food basket will be: • This is the food poverty line
Poverty indicators • Use household consumption per capita and compare to the poverty line for each household to classify a household as poor Poverty headcount: share of population below poverty line Poverty gap: how far are the poor from the poverty line
Poverty indicators • We can use the food poverty line to analyse the percent of the population with food consumption below the food poverty line • To create this indicator, compare the household food consumption aggregate against the food poverty line and create a bivariate variable: FoodPoor = 1 Else FoodPoor= 0