Download

1 / 36
360 likes | 719 Views
Section 4.4. Creating Randomization Distributions. Randomization Distributions. How do we estimate P - values using randomization distributions? Today we’ll discuss ways to simulate randomization samples for a variety of situations. Simulate samples, assuming H 0 is true

E N D
Section 4.4 Creating Randomization Distributions
Randomization Distributions How do we estimate P-values usingrandomization distributions? Today we’ll discuss ways to simulate randomization samples for a variety of situations. Simulate samples, assuming H0 is true Calculate the statistic of interest for each sample Find the p-value as the proportion of simulated statistics as extreme as the observed statistic
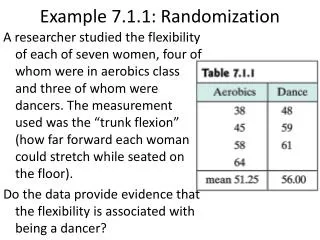
Cocaine Addiction • In a randomized experiment on treating cocaine addiction, 48 people were randomly assigned to take either Desipramine (a new drug), or Lithium (an existing drug), and then followed to see who relapsed • Question of interest: Is Desipramine better than Lithium at treating cocaine addiction?
Cocaine Addiction • What are the null and alternative hypotheses? • What are the possible conclusions?
Cocaine Addiction • What are the null and alternative hypotheses? • What are the possible conclusions? Let pD, pLbe the proportion of cocaine addicts who relapse after taking Desipramine or Lithium, respectively. H0: pD= pL Ha: pD< pL Reject H0:Desipramineis better than Lithium Do not reject H0: We cannot determine from these data whether Desipramine is better than Lithium
R R R R R R R R R R R R R R R R R R R R R R R R R R R R R R R R R R R R R R R R R R R R R R R R 1. Randomly assign units to treatment groups Desipramine Lithium R R R R R R R R R R R R R R R R R R R R R R R R R R R R R R R R R R R R R R R R R R R R
2. Conduct experiment 3. Observe relapse counts in each group R = Relapse N = No Relapse 1. Randomly assign units to treatment groups Desipramine Lithium R R R R R R R R R R R R R R R R R R R R R R R R R R R R R R R R R N R N R R R R R R R R R R R R R N R N N N N N N N N N R R R R R R R R R R R R N N N N N N N N N N N N N N N N N N N N N N N N 10 relapse, 14 no relapse 18 relapse, 6 no relapse
Measuring Evidence against H0 To see if a statistic provides evidence against H0, we need to see what kind of sample statistics we would observe, just by random chance, if H0 were true
Cocaine Addiction • “by random chance” means by the random assignment to the two treatment groups • “if H0 were true” means if the two drugs were equally effective at preventing relapses (equivalently: whether a person relapses or not does not depend on which drug is taken) • Simulate what would happen just by random chance, if H0 were true…
R R R R R R R R R R R R R R R R N N R R R R R R N N N N N N R R R R R R N N N N N N N N N N N N 10 relapse, 14 no relapse 18 relapse, 6 no relapse
R R R R R R R R R R R R R R R R N N R R R R R R N N N N N N R R R R R R N N N N N N N N N N N N Simulate another randomization Desipramine Lithium R N R N N N N R R R R R R R N R R N N N R N R R R N N R N R R N R N N N R R R N R R R R 16 relapse, 8 no relapse 12 relapse, 12 no relapse
Simulate another randomization Desipramine Lithium R R R R R R R R R R R R R N R R N N R R R R R R R R N R N R R R R R R R R N R N R R N N N N N N 17 relapse, 7 no relapse 11 relapse, 13 no relapse
Simulate Your Own Sample • In the experiment, 28 people relapsed and 20 people did not relapse. Create cards or slips of paper with 28 “R” values and 20 “N” values. • Pool these response values together, and randomly divide them into two groups (representing Desipramine and Lithium) • Calculate your difference in proportions • Plot your statistic on the class dotplot • To create an entire randomization distribution, we simulate this process many more times with technology: StatKey
www.lock5stat.com/statkey p-value
Randomization Distribution Center A randomization distribution is centered at the value of the parameter given in the null hypothesis. A randomization distribution simulates samples assuming the null hypothesis is true, so
Randomization Distribution In a hypothesis test for H0: = 12 vsHa: < 12, we have a sample with n = 45 and What do we require about the method to produce randomization samples? • = 12 • < 12 We need to generate randomization samples assuming the null hypothesis is true.
Randomization Distribution In a hypothesis test for H0: = 12 vsHa: < 12, we have a sample with n = 45 and . Where will the randomization distribution be centered? • 10.2 • 12 • 45 • 1.8 Randomization distributions are always centered around the null hypothesized value.
Randomization Distribution In a hypothesis test for H0: = 12 vsHa: < 12, we have a sample with n = 45 and What will we look for on the randomization distribution? • How extreme 10.2 is • How extreme 12 is • How extreme 45 is • What the standard error is • How many randomization samples we collected We want to see how extreme the observed statistic is.
Randomization Distribution In a hypothesis test for H0: m1 = m2 , Ha: m1 > m2 sample mean #1 = 26 and sample mean #2 = 21. What do we require about the method to produce the randomization samples? • 1 = 2 • 1 > 2 • 26, 21 We need to generate randomization samples assuming the null hypothesis is true.
Randomization Distribution In a hypothesis test for H0: m1 = m2 , Ha: m1 > m2 sample mean #1 = 26 and sample mean #2 = 21. Where will the randomization distribution be centered? • 0 • 1 • 21 • 26 • 5 The randomization distribution is centered around the null hypothesized value, 1- 2 = 0
Randomization Distribution In a hypothesis test for H0: m1 = m2 , Ha: m1 > m2 sample mean #1 = 26 and sample mean #2 = 21. What do we look for in the randomization distribution? • The standard error • The center point • How extreme 26 is • How extreme 21 is • How extreme 5 is We want to see how extreme the observed difference in means is.
Randomization Distribution For a randomization distribution, each simulated sample should… be consistent with the null hypothesis use the data in the observed sample reflect the way the data were collected
Randomized Experiments • In randomized experiments the “randomness” is the random allocation to treatment groups • If the null hypothesis is true, the response values would be the same, regardless of treatment group assignment • To simulate what would happen just by random chance, if H0 were true: • Reallocate cases to treatment groups, keeping the response values the same
Observational Studies In observational studies, the “randomness” is random sampling from the population To simulate what would happen, just by random chance, if H0 were true: Simulate drawing samples from a population in which H0 is true How do we simulate sampling from a population in which H0 is true when we only have sample data? Adjust the sample to make H0 true, then bootstrap!
Body Temperatures Let m = the average human body temperature H0: m = 98.6 Ha: m≠ 98.6 • Adjust the sample by adding 98.6 – 98.26 = 0.34 to each value. The sample mean becomes 98.6, exactly the value given by the null hypothesis. • Bootstrapping the adjusted sample allows us to simulate drawing samples as if the null is true! sample mean = 98.26
Body Temperatures • In StatKey, when we enter the null hypothesis, this shifting is automatically done for us • StatKey p-value = 0.002
Exercise and Gender • Do males exercise more hours per week than females? • State null and alternative hypotheses • Devise a way to generate a randomization sample that • Uses the observed sample data • Makes the null hypothesis true • Reflects the way the data were collected sample mean difference xm– xf= 3
Exercise and Gender • H0: m = fHa: m> f • Generating a randomization distribution can be done with the “shift groups” method: • To make H0 true set the sample means equal by adding 3 to every female value. Now bootstrap from this modified sample • Note: There are other ways. In StatKey, the default randomization method is “Reallocate Groups”, but “Shift Groups” is also an option.
Exercise and Gender p-value = 0.095
Exercise and Gender The p-value is 0.095. Using α = 0.05, we conclude…. • Males exercise more than females, on average • Males do not exercise more than females, on average • Nothing Do not reject the null… we can’t conclude anything.
Blood Pressure and Heart Rate • Is blood pressure negatively correlated with heart rate? • State null and alternative hypotheses • Devise a way to generate a randomization sample that • Uses the observed sample data • Makes the null hypothesis true • Reflects the way the data were collected sample correlation r = -0.037
Blood Pressure and Heart Rate • H0: = 0 Ha: < 0 • Generating a randomization distribution: • Two variables have correlation 0 if they are not associated (null hypothesis). We can “break the association” by randomly shuffling one of the variables. • Each time we do this, we get a sample we might observe just by random chance, if there really is no correlation
Blood Pressure and Heart Rate Even if blood pressure and heart rate are not correlated, we would see correlations this extreme about 22% of the time, just by random chance. p-value = 0.219
Randomization Distributions: Cocaine Addiction (randomized experiment) • Rerandomize cases to treatment groups, keeping response values fixed Body Temperature (single mean) • Shift to make H0 true, then bootstrap Exercise and Gender (observational study) • Shift to make H0 true, then bootstrap Blood Pressure and Heart Rate (correlation) • Randomly shuffle one variable
Generating Randomization Samples • As long as the original data is used and the null hypothesis is true for the randomization samples, most methods usually give similar p-values • StatKeygenerates the randomizations for us. We will not be concerned with the details of the process. It is enough to understand the general principles.
Summary • Randomization samples should be generated • Consistent with the null hypothesis • Using the observed data • Reflecting the way the data were collected • The specific method varies with the situation, but the general idea is always the same