Download
1 / 21
210 likes | 325 Views
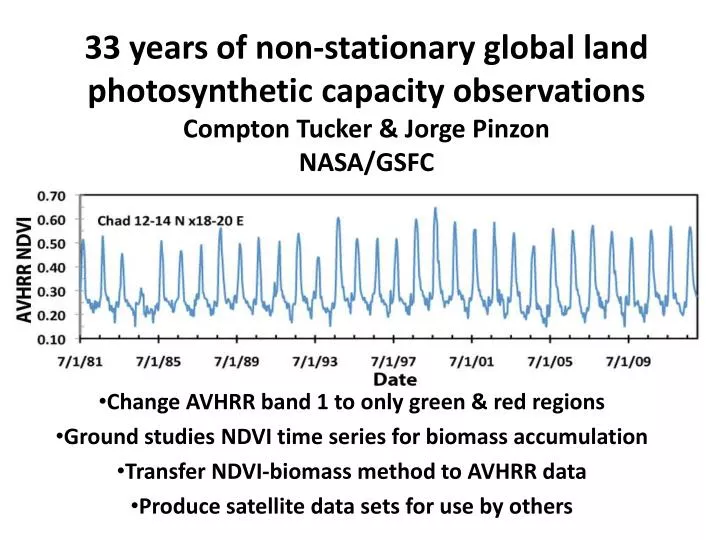
33 years of non-stationary global land photosynthetic capacity observations Compton Tucker & Jorge Pinzon NASA/GSFC. Change AVHRR band 1 to only green & red regions Ground studies NDVI time series for biomass accumulation Transfer NDVI-biomass method to AVHRR data

E N D
33 years of non-stationary global land photosynthetic capacity observationsCompton Tucker & Jorge PinzonNASA/GSFC • Change AVHRR band 1 to only green & red regions • Ground studies NDVI time series for biomass accumulation • Transfer NDVI-biomass method to AVHRR data • Produce satellite data sets for use by others
The TIROS-N AVHRR The NOAA person(s) responsible for these excellent examples of poor spectral resolution should be tarred and feathered. Overlapping bands are a mistake Ch 2 Ch 1 (Very broad or wide spectral bands)
Bad Design for TIROS-N Channel 1 From my PhD dissertation Chapter 5 (1975) and Tucker and Maxwell 1976: Working in 1976 with Stan Schneider and Dave McGinnis of NOAA/NESDIS, AVHRR channel 1 was changed starting with NOAA-6
NOAA AVHRR 8-km NDVI Data Set Radiation
NOAA AVHRR 8-km NDVI Data SetDiffuse average daily PAR[W/m2/mic] (0.4-0.7 mic) El Chichon (1982-1984) Mt. Pinatubo (1991-1994)
NDVI summed vs. total dry biomass Explained 80% of biomass accumulation
km2 #pixels: Gome-2 AVHRR MODIS Area 1: 615,620 336 9.6k 12M Area 2: 285,112 144 4.5k 5.7M Area3: 513,017 280 8.1k 10M A1sub1: 22,573 32 373 0.5M A2sub1: 30,342 49 477 0.7M A3sub1: 28,268 49 444 0.6M