Download
1 / 22
220 likes | 334 Views
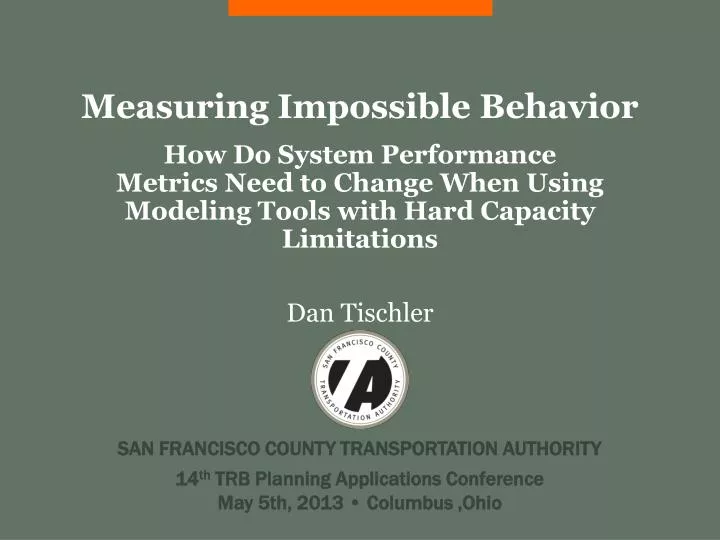
Measuring Impossible Behavior. How Do System Performance Metrics Need to Change When Using Modeling Tools with Hard Capacity Limitations Dan Tischler. 14 th TRB Planning Applications Conference May 5th, 2013 • Columbus ,Ohio. Outline. Background – SF and DTA The capacity conundrum

E N D
Measuring Impossible Behavior How Do System Performance Metrics Need to Change When Using Modeling Tools with Hard Capacity Limitations Dan Tischler SAN FRANCISCO COUNTY TRANSPORTATION AUTHORITY 14th TRB Planning Applications Conference May 5th, 2013 • Columbus ,Ohio
Outline • Background – SF and DTA • The capacity conundrum • DTA-appropriate metrics • Sharing time SAN FRANCISCO COUNTY TRANSPORTATION AUTHORITY
Modeling Framework Land Use Transportation System ABM w/ Static Assignment (CHAMP) Auto Demand in Subarea Dynamic Assignment Model (Dynameq) Intersection Volumes Roadway Performance Transit & Non Motorized Demand Analytical Traffic Assessment (Synchro) Auto Demand Microsimulation (VISSIM) Roadway Performance Transit Performance SAN FRANCISCO COUNTY TRANSPORTATION AUTHORITY
DTA Applications • Freeway replacement • Bus rapid transit • Road closure • HOV ramps and lanes conversion • Congestion pricing (model dev. scenario test) bettermarketstreetsf.org/ http://www.sfcta.org presidioparkway.org SAN FRANCISCO COUNTY TRANSPORTATION AUTHORITY
Reflections on Experiences • The good • More realistic assignment (you can’t jam unrealistic traffic through bottlenecks) • Backups that impact nearby links are represented • Traffic patterns/paths change at different times in response to varying traffic conditions • Understands congestion for individual lanes and intersections • Dynamic demand, even if we don’t fully use it SAN FRANCISCO COUNTY TRANSPORTATION AUTHORITY
Reflections on Experiences • The so-so or not so good • Demand from ABM may not be appropriate • Metrics used to interpret results provide different answers • Travel demand modelers may lack traffic operations experience SAN FRANCISCO COUNTY TRANSPORTATION AUTHORITY
Outline • Background – SF and DTA • The capacity conundrum • DTA-appropriate metrics • Sharing time SAN FRANCISCO COUNTY TRANSPORTATION AUTHORITY
Hypothetical Project HOV Project area CBD • Project to convert one freeway lane to HOV-only • Will traffic diversions from the freeway affect transit? Arterial roadway Road-based transit Connector St Freeway SAN FRANCISCO COUNTY TRANSPORTATION AUTHORITY
Static Model Results HOV Project area CBD • HOV lane pushes auto trips to the arterial • Transit speeds and reliability worsen • Indicates need for bus-only lane Congestion Road-based transit Diversions SAN FRANCISCO COUNTY TRANSPORTATION AUTHORITY
Dynamic Traffic Assignment Results HOV Project area CBD • More traffic stays on freeway • Freeway speeds decline • Some diversions go elsewhere • Transit not impacted Congestion Road-based transit SAN FRANCISCO COUNTY TRANSPORTATION AUTHORITY
DTA Hidden Story HOV Project area CBD • Bottleneck at signal causes long queues on Connector St • Connector St has short green phase because volumes are currently low • In practice traffic engineers would adjust signal capacity as travel changes Road-based transit Bottleneck Queue SAN FRANCISCO COUNTY TRANSPORTATION AUTHORITY
Circular Feedback SAN FRANCISCO COUNTY TRANSPORTATION AUTHORITY
What Are We Trying to Accomplish? ? LMFAO music video via Youtube SAN FRANCISCO COUNTY TRANSPORTATION AUTHORITY
Outline • Background – SF and DTA • The capacity conundrum • DTA-appropriate metrics • Sharing time SAN FRANCISCO COUNTY TRANSPORTATION AUTHORITY
Do’s and Don’ts of Interpreting DTA Results SAN FRANCISCO COUNTY TRANSPORTATION AUTHORITY
Queuing • Queues blocking intersections = poorly functioning network • Possible measures • Tot length of all queues • Blocked intersections SAN FRANCISCO COUNTY TRANSPORTATION AUTHORITY
Vehicle Delay SAN FRANCISCO COUNTY TRANSPORTATION AUTHORITY
Waiting Vehicles SAN FRANCISCO COUNTY TRANSPORTATION AUTHORITY
Gridlock SAN FRANCISCO COUNTY TRANSPORTATION AUTHORITY
Outline • Background – SF and DTA • The capacity conundrum • DTA-appropriate metrics • Sharing time SAN FRANCISCO COUNTY TRANSPORTATION AUTHORITY
Sharing is Caring SAN FRANCISCO COUNTY TRANSPORTATION AUTHORITY
Thank you! • Dan Tischler • dan [dot] tischler [at] sfcta [dot] org SAN FRANCISCO COUNTY TRANSPORTATION AUTHORITY